From the category archives:

Statistics

Mean and Regressive

by Henry Farrell on September 28, 2010

I just finished reading Justin Fox’s “The Myth of the Rational Market”:http://www.amazon.com/gp/product/0060599030?ie=UTF8&tag=henryfarrell-20&linkCode=as2&camp=1789&creative=390957&creativeASIN=0060599030 (yes: two years late – I know), and came across this story about Daniel Kahneman which I didn’t know, and which illustrates one of those points that is _ex post_ obvious, but _ex ante_ rather brilliant.

bq. The only point Daniel Kahneman was trying to get across was that praise works better than punishment. The Israeli Air Force flight instructors to whom the Hebrew University psychologist delivered his speech that day in Jerusalem in the mid-1960’s were dubious. One veteran instructor retorted:

On many occasions I have praised flight cadets for clean execution of some aerobatic maneuver, and in general when they try it again they do worse. On the other hand, I have often screamed at cadets for bad execution, and in general they do better. So please don’t tell us that reinforcement works and punishment does not, because the opposite is the case.

bq. As a man trained in statistics, Kahneman saw that _of course_ a student who had just brilliantly executed a maneuver (and was thus praised for it) was less likely to perform better the next time around than a student who had just screwed up. Abnormally good or bad performance is just that – abnormal, which means it is unlikely to be immediately repeated. But Kahneman could also see how the instructor had come to his conclusion that punishment worked. “Because we tend to reward others when they do well and punish them when they do badly, and because there is regression to the mean,” he later lamented, “it is part of the human condition that we are statistically punished for rewarding others and rewarded for punishing them.”
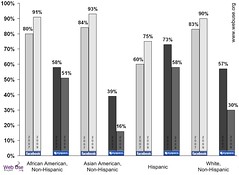
Two years ago, as part of a collection of articles researching social network site uses, I published a piece (blog post here) about the different predictors of Facebook and MySpace use among a diverse group of first-year college students. Some of the reactions to that paper suggested that the the differences by race/ethnicity and socioeconomic status identified in the data were only temporary and would soon change.

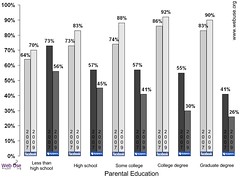
Change in Facebook and MySpace use by race/ethnicity among a group of college students, 2007-2009I now have some new data to consider possible changes over the past two years. I haven’t written this up in any formal way yet (nor do I have more elaborate statistical analyses to share right now), but I do have some figures suggesting that the differences I identified two years ago persist today.

Note that this is a new cohort of first-year students (i.e., not the same students resurveyed two years later) at the same universitywhere I conducted the study in 2007. (See details about the data collection and sample descriptives at the end of this post.)

Change in Facebook and MySpace use by parental education among a group of college students, 2007-2009There are two main findings here. (Click on the images for larger versions or see the table below.) First, there is a general increase in use of Facebook and a general decline in use of MySpace across the board. In 2007, 79% of the study participants were using Facebook while in 2009, 87% of the sample reports doing so. In contrast, while in 2007, 55% of the group reported using MySpace, in 2009, only 36% do so. [click to continue…]

The news that NICE has put acupuncture and chiropractic on the list of approved therapies for non-specific lower back pain has led to about the reactions you’d expect – back-slapping and high-fiving from the crystals and “life force” crowd, agonised complaining from the professional skeptics. But it’s actually a sign of something that ought to make us worry, not much but at least a little bit, about the way in which we’re doing medical science in this country.
[click to continue…]

Do Churchgoers and Republicans Consume More Porn?

by Henry Farrell on February 28, 2009

Andrew Sullivan “links to”:http://andrewsullivan.theatlantic.com/the_daily_dish/2009/02/christianists-a.html a “New Scientist”:http://www.newscientist.com/article/dn16680-porn-in-the-usa-conservatives-are-biggest-consumers.html story suggesting that they do.

However, there are some trends to be seen in the data. Those states that do consume the most porn tend to be more conservative and religious than states with lower levels of consumption, the study finds. … Eight of the top 10 pornography consuming states gave their electoral votes to John McCain in last year’s presidential election – Florida and Hawaii were the exceptions. While six out of the lowest 10 favoured Barack Obama.

But if you look at the “actual study”:http://people.hbs.edu/bedelman/papers/redlightstates.pdf (PDF), not so much.

bq. The fourth column reports that in regions where more people report regularly attending religious services (per National Election Studies 2004), overall subscription rates are not statistically significantly different from subscriptions elsewhere (p 0.848).

bq. … Furthermore, I found no significant relationship between subscriptions to this adult entertainment service and presidential voting in 2004, based on poll data by congressional district. However, using individual-level data from a Hitwise sample of ten million anonymized U.S. Internet users, Tancer (2008), finds that adult escort sites are more popular in blue states that voted for Gore in 2004, while visitors from the red states that voted for Bush in 2004 are more likely to visit wife-swapping sites, adult webcams, and sites about voyeurism.

What evidence there is in the paper of a relationship between religious faith and porn consumption seems, as best as I can interpret the relevant table, to be based on a simple OLS regression with no reported control variables. Nor does there seem to be _any_ discussion in the piece of correlations between porn consumption and voting patterns in the most recent presidential election.

I’m not sure whether to blame the New Scientist or the paper’s author, who perhaps seems (if quoted fairly and accurately, which is of course by no means certain – he could have made a few vague handwaves that were taken completely out of context) to have hammed up his results a bit in the interview. But even if there _were_ strong results, they wouldn’t necessarily tell us much. The data is all aggregated at the state or zipcode level, but the decision to purchase or not purchase porn online is obviously an individual one. There are _all sorts_ of obvious ecological problems in drawing inferences about religious people’s individual propensities from aggregate data. This is directly analogous to “Heritage horseflop”:https://crookedtimber.org/2007/11/06/a-little-rich/ claiming that because rich states tend to support Democrats, therefore the Democrats are the party of the rich. As Gelman, Park et al. showed, that inference was directly misleading. Similarly, even if people in more religious or Republican states _were_ more inclined to purchase porn online, this doesn’t imply that religious _people_ or _individual_ Republicans were more inclined to purchase porn online, and I can think of at least two or three plausible alternative causal mechanisms that would explain the observed correlation.

R in The New York Times

by Kieran Healy on January 7, 2009

Funny to see the virtues of R extolled in The New York Times. Although I did wonder whether Professor Ripley spilled his tea when he read this effort at introducing Times readers to it:

Some people familiar with R describe it as a supercharged version of Microsoft’s Excel spreadsheet software that can help illuminate data trends more clearly than is possible by entering information into rows and columns.

On second thoughts, though, I imagine no tea was spilled. It would take rather more than that. There is the required bit of stuffy huffiness from a spokesperson for the SAS Institute, too:

SAS says it has noticed R’s rising popularity at universities, despite educational discounts on its own software, but it dismisses the technology as being of interest to a limited set of people working on very hard tasks. “I think it addresses a niche market for high-end data analysts that want free, readily available code,” said Anne H. Milley, director of technology product marketing at SAS. She adds, “We have customers who build engines for aircraft. I am happy they are not using freeware when I get on a jet.”

R also gets some stick (though not in the article) from the computer science side of things for being fairly slow in comparison to some potential competitors. But it’s an exemplary open-source project and is now the lingua franca of academic statistics, for good reason. In day-to-day use for its designed purpose it’s hard to beat. The commitment of many of the core project contributors is really remarkable. In the social sciences R’s main competitor is Stata, which also has many virtues (including a strong user community) but costs money to own. I like R because it helps keep your data analysis honest, it has very strong graphical capabilities, it’s a gateway to understanding new work in statistics, and it’s free. Just take my advice and be sure to read the Posting Guide before you start asking any questions on r-help.

Netflix Weirdness

by Kieran Healy on November 23, 2008

There’s an article on the Netflix Prize in the Times today. You know, where Netflix made half of its ratings data available to people and offered a million bucks to anyone who could write a recommendation algorithm that would do some specified percent better than Netflix’s own. What tripped me up was this sentence about one of the more successful teams:

The first major breakthrough came less than a month into the competition. A team named Simon Funk vaulted from nowhere into the No. 4 position, improving upon Cinematch by 3.88 percent in one fell swoop. Its secret was a mathematical technique called singular value decomposition. It isn’t new; mathematicians have used it for years to make sense of prodigious chunks of information. But Netflix never thought to try it on movies.

Can this possibly be true? I’d have thought that just about the most obvious way to look for some kind of structure in data like this would be to do a principal components analysis, and PCA is (more or less) just the SVD of a data matrix. PCA is a quite straightforward technique (evidence for this includes the fact that I know about and use it myself). It’s powerful, but it’s not like it’s some kind of slightly obscure method that isn’t ever applied to data of this kind. And there’s a whole family of related and more sophisticated approaches you could use instead. If you’d asked me about the prize before I read this article, I would naively have said “Well, it’s this effort to get people to help Netflix do better than I guess anyone could using something like bog-standard PCA.”

Maybe the article just got written up in a way that misrepresents the contribution of the team who introduced the method to the data. Or maybe I am misunderstanding something. I guess I should page Cosma and see what he thinks.

Make-work

by Kieran Healy on November 19, 2008

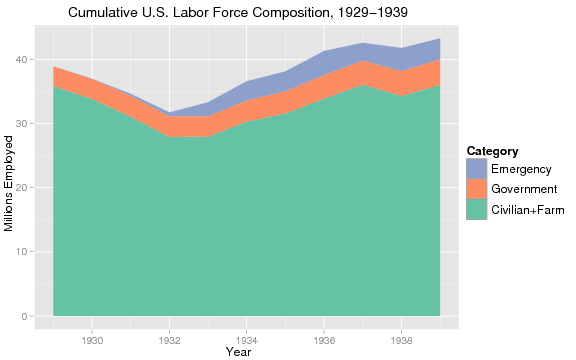
I’m so far behind on this one. Here’s a figure based on a table Eric sent me.

Composition of the workforce 1929-1939

There is a PDF version. There is also a 4-category version (with a PDF too), that breaks out farm workers from the main category.

Valuing Children

by Ingrid Robeyns on September 15, 2008

Finally and “long overdue”:https://crookedtimber.org/2008/05/20/care-talk-blog/, here is my book review of Valuing Children, Nancy Folbre’s latest book. The overall goal of this book is to show how and why children matter for economic life, to provide estimates of the economic value of family (nonmarket) childcare and parental expenditures in the USA, and to raise critical questions about the size and kinds of public spending on children in the USA.

Folbre formulates four questions which she sets out to answer: (1) Why should we care about spending on the children? (2) How much money and time do parents devote to children? (3) How much money do taxpayers spend on children? And (4) who should pay for the kids (in other words, which share of the costs of children should be borne by parents and by the government)?
[click to continue…]

Everything Old Is New Again

by Kieran Healy on July 1, 2008

Consider the following piece in the Daily Telegraph, which may begin making the rounds:

Scientists find ‘law of war’ that predicts attacks: Scientists believe they may have glimpsed a “law of war” that can be used to predict the likelihood of attacks in modern conflicts, from conventional battles to global terrorism. … The European Consortium For Mathematics in Industry was told today that an international team has developed a physics-based theory describing the dynamics of insurgent group formation and attacks, which neatly explains the universal patterns observed in all modern wars and terrorism. The team is advising the United Nations, the Pentagon and Iraq. …

Most remarkable, “or the case of modern insurgent conflicts, our results are in close agreement with observed casualty data.” “What we found was really quite startling,” said Prof Johnson. “Although wars are the antithesis of an ordered system, the datapoints for each war fell neatly on to a straight line.” The line meant they obeyed what scientists call a power law. The “power laws” describe mathematical relationships between the frequency of large and small events.

This finding is remarkable given the different conditions, locations and durations of these separate wars. For example, the Iraq war is being fought in the desert and cities and is fairly recent, while the twenty-year old Colombian war is being fought in mountainous jungle regions against a back-drop of drug-trafficking and Mafia activity. This came as a shock, said the team, since the last thing one would expect to find within the chaos of a warzone are mathematical patterns. …

“We can use the power-law distribution to accurately predict the likelihood of different sized attacks occurring on any given day. This is useful for military planning and allocating resources to hospitals. .. “The fact that the power-law distribution seems to be constant across all long-term modern wars suggests that the insurgencies have evolved to find an ideal solution to the problem of how to fight a stronger force. … “Unless this structure is changed then the cycle of violence in places like Iraq will continue,” said Dr Gourley.” We have used this analysis to advise the Pentagon, the Iraqi government and the United Nations.”

This one has all the ingredients: a few economists, some physicists, a couple of papers on arxiv, power laws, media coverage, and of course the thrilling sense that no-one has noticed anything like this before. Except, of course, they have.

[click to continue…]

No idea more obscure and uncertain

by Kieran Healy on June 30, 2008

You only have to hang around the world of social science research- or policy-related blogging for a few hours before you come across someone willing to snottily inform you, or some other luckless interlocutor, that although the finding of this or that paper may appeal to you, nevertheless don’t you know that Correlation Is Not Causation. Often this seems to be the only thing they know about statistics.

I grudgingly admit that it’s a plausible-sounding rule, and in the textbooks and stuff. But, to be honest, I read it too many times in various posts and comments threads the other day, and in my raging pique I found myself thinking that the next time it happened I would say, “That’s completely backwards: in fact, causation is just correlation” and fling a copy of Hume’s first Enquiry at their head. Or at the screen, I suppose, but that image is less satisfying, because now who’s the crank on the internet, etc.

This Halloween when we take the kids Trick-or-Treating, I will dress up as Correlation, as befits a social scientist. My wife will of course be Causation.

Gender differences in sharing creative content online

by Eszter Hargittai on June 25, 2008

This ArsTechnica write-up of some recent research of mine has received numerous votes on the recommendation site Digg in the last few hours. I wonder if it will make the front page of Digg, although as a Twitter contact of mine noted, since it’s not a top-10 list (nor, if I might add, does it cover Google or Apple), that may be unlikely.

The post reports on a study in which we found that male college students are more likely than their female counterparts to share creative content online even though both men and women in the sample are equally likely to create such content. However, when controlling for online skill, the gender differences in posting go away.

Gina Walejko and I published the paper “The Participation Divide: Content Creation and Sharing in the Digital Age” this Spring in the journal Information, Communication and Society. We examine the extent to which college students share creative content online and whether we can identify any systematic differences by user background. In particular, we looked at whether students create and share the following types of material: poetry/fiction, artistic photography, music, and video (both completely own and remixed in the case of the latter two), including both private and public sharing. [click to continue…]

The collapsing American middle class

by Chris Bertram on May 6, 2008

Surfing over to Charles Dodgson‘s site yesterday, I happened upon Elizabeth Warren’s lecture on the squeeze on the American middle class since the 1970s. Then you could bring up a family on one income; now you can’t. Then non-discretionary spending made up a smaller proportion of household spending; now, it dominates. Result: if a parent loses their job or gets sick, bankruptcy looms. I didn’t expect to sit watching a YouTube video for whole hour but I was riveted by the story Warren tells with the consumption statistics.

I was kind of reluctant to blog this too. After all, there are others at CT who do sociology or economics or family policy and I don’t do those things. And I’m not an American resident either. Still, it struck me as pretty compelling. I wonder how similar the change has been in the other OECD countries?

The one per cent doctrine

by Chris Bertram on April 5, 2008

Jeremy Waldron has a great piece in the latest LRB reviewing a recent book by Cass Sunstein. He has a nice discussion of the Cheney doctrine that even a one-percent probability of a catastrophic event should be treated as a certainty for policy purposes, where the class of catastrophic events is limited to those with a military, security or terrorist dimension. Reasoning like this interacts neatly with “ticking-bomb” scenarios: now a 1 per cent chance that the there’s a ticking bomb the terrorist knows about is sufficient in to justify waterboarding or worse. Of course other potentially catastrophic developments — such as climate change — haven’t generated a “treat as if certain” policy response from the US government, even thought even the most determined denialists must evaluate the probability that anthropogenic global warming is happening at greater than one in a hundred.

Waldron is also pretty acid about Sunstein’s treatment of global warming and distributive justice, noting some of the shortcomings of the idea that poor people’s lives should be valued according to what they’re prepared to pay to avoid the risk of death. But read the whole thing, as they say.

Seeing Like “Seeing Like a State”

by Henry Farrell on February 5, 2008

My long “post”:https://crookedtimber.org/2007/10/31/delong-scott-and-hayek/ from a couple of months ago on James Scott’s _Seeing Like a State_ and Brad DeLong’s review of it enjoyed a temporary revival when Brad “republished”:http://delong.typepad.com/sdj/2007/12/delong-smackd-1.html it in his ‘DeLong Smackdown’ series. But I got a bit of grief from one reader, who thought that I had given Scott far too easy a ride. Which is probably true – while I admire the book, I do have many disagreements with it, which I would have gotten into if I had been reviewing the book proper, rather than arguing against Brad’s interpretation. One such disagreement popped up when I was reading it again for class a couple of weeks ago, together with John Brewer’s _The Sinews of Power._1
[click to continue…]

Post-Invasion Deaths in Iraq

by Kieran Healy on January 10, 2008

A new study estimates violence-related mortality in Iraq between 2003 and 2006:

Background Estimates of the death toll in Iraq from the time of the U.S.-led invasion in March 2003 until June 2006 have ranged from 47,668 (from the Iraq Body Count) to 601,027 (from a national survey). Results from the Iraq Family Health Survey (IFHS), which was conducted in 2006 and 2007, provide new evidence on mortality in Iraq.

Methods The IFHS is a nationally representative survey of 9345 households that collected information on deaths in the household since June 2001. We used multiple methods for estimating the level of underreporting and compared reported rates of death with those from other sources.

Results Interviewers visited 89.4% of 1086 household clusters during the study period; the household response rate was 96.2%. From January 2002 through June 2006, there were 1325 reported deaths. After adjustment for missing clusters, the overall rate of death per 1000 person-years was 5.31 (95% confidence interval [CI], 4.89 to 5.77); the estimated rate of violence-related death was 1.09 (95% CI, 0.81 to 1.50). When underreporting was taken into account, the rate of violence-related death was estimated to be 1.67 (95% uncertainty range, 1.24 to 2.30). This rate translates into an estimated number of violent deaths of 151,000 (95% uncertainty range, 104,000 to 223,000) from March 2003 through June 2006.

Conclusions Violence is a leading cause of death for Iraqi adults and was the main cause of death in men between the ages of 15 and 59 years during the first 3 years after the 2003 invasion. Although the estimated range is substantially lower than a recent survey-based estimate, it nonetheless points to a massive death toll, only one of the many health and human consequences of an ongoing humanitarian crisis.

150,000 violent deaths in three years is a lot. You’ll recall that the _Lancet_ study estimated about 655,000 excess deaths, which is a lot more. The two numbers aren’t directly comparable because excess deaths due to violence are only one component of all excess deaths (e.g., from preventable disease or other causes attributable to the war). Deaths due to violence rose from a very small 0.1 per 1000 person years in the pre-invasion period to about 1.1 per 1000py afterwards, or 1.67 adjusting for estimated underreporting. This is where the authors get their 151,000 number. The overall death rate rose from about 3.2 per 1000 person years to about 6, an increase of just over 2.8. Depending on whether you use the raw or adjusted estimated rate of violent death this would work out to an overall excess death total of just under 400,000 or just over 250,000. (But this is just a back-of-the-envelope calculation, as the overall death rate isn’t reported.)

[click to continue…]