From the category archives:

Social Science

Racism, Still Not Dead

by Belle Waring on October 18, 2006

From today’s Washington Post, an interesting paper by Vanderbilt economist Joni Hersch on the correlation between skin color and economic success among recent immigrants. (Pdf here.)

Immigrants with the lightest complexions earned, on average, about 8 to 15 percent more than those with the darkest skin tone after controlling for race and country of origin as well as for other factors related to earnings, including occupation, education, language skills, work history, type of visa and whether they were married to a U.S. citizen.

In fact, Hersch estimated that the negative impact of skin tone on earnings was equal to the benefit of education, with a particularly dark complexion virtually wiping out the advantage of education on earnings….

Hersch based her results on 2,084 men and women who participated in face-to-face interviews for the federally funded 2003 New Immigrant Survey. All of the respondents had been admitted to lawful permanent resident status during the seven-month period, May to November 2003. As part of the survey, interviewers also rated the skin tone of each individual on an 11-point scale ranging from zero to 10, with 10 representing the darkest possible skin color and zero the absence of color, or albinism.

Why should pale people earn more? “I don’t think that any explanation other than discrimination is possible — and I am not one to draw such inferences lightly,” Hersch said in an e-mail. “I am stunned by the strength and consistency of the findings, even controlling for race, even controlling for nationality, and . . . everything that could possibly matter.”

This was true even for white european people; Estonians would apparently sail past swarthy Mediterranean types (not a particular finding from the paper, mind.) In her paper she mentions that among US-born black men there is also correlation between lighter skin and higher wages, but doesn’t say whether among US-born whites there is a premuim placed on paleness. I would be inclined to say not, but then, it seems hard to imagine how this pressure could apply only to immigrants. Rather striking results, though. It’s also easy to see why the nigh-transparent complexions of Irish university profs give them an edge in the US job market.

Floating the Fraud Balloon

by Kieran Healy on October 18, 2006

“Daniel wrote a piece”:http://commentisfree.guardian.co.uk/daniel_davies/2006/10/how_to_not_lie_with_statistics.html for the Guardian’s blog saying that critics who wanted to reject the findings of Burnham et al.’s “Lancet paper”:http://www.thelancet.com/webfiles/images/journals/lancet/s0140673606694919.pdf and believe the Iraq Body Count estimate (or similar-sized numbers) were going to have to come out and claim that the paper was fraudulent, “and presumably to accept the legal consequences of doing so.” Well, now “David Kane has floated that balloon.”:http://www.iq.harvard.edu/blog/sss/archives/2006/10/a_case_for_frau.shtml

*Update*: Kane’s accusations have been removed from the front page of the SSS blog. In a “follow-up,”:http://www.iq.harvard.edu/blog/sss/archives/2006/10/removed_a_case.shtml Amy Perfors apologises for the error of judgment and says they removed the post because the “tone is unacceptable, the facts are shoddy, and the ideas are not endorsed by myself, the other authors on the sidebar, or the Harvard IQSS.” Good for them.

[click to continue…]

More Burnham et al.

by Kieran Healy on October 16, 2006

Here are some comments from “Andrew Gelman”:http://www.stat.columbia.edu/~cook/movabletype/archives/2006/10/estimate_of_ira.html on the “Burnham et al. paper”:http://www.thelancet.com/webfiles/images/journals/lancet/s0140673606694919.pdf. People who’d like (or ought) to learn more about statistics could do worse than read Gelman and Nolan’s terrific Teaching Statistics: A Bag of Tricks. I am slightly embarrassed to admit that I am awaiting the publication of Gelman and Hill’s Data Analysis Using Regression and Multilevel/Hierarchical Models with a degree of anticipation that seems indecent (or unhealthy) to direct at a statistics textbook. (More about the book “here”:http://www.cambridge.org/catalogue/catalogue.asp?isbn=052168689X. Note the blurb from a well-known blogger.)

Statistics and the Scale of Societies

by Kieran Healy on October 12, 2006

How many people are murdered in the U.S. every day? How many people die in car accidents every day? How many people die of heart disease in the U.S. in a year? What about the number who die for any reason at all? If you don’t know the answer to these questions, do you have immediate, confident intuitions about what the answers must be?

The “Lancet paper”:http://www.thelancet.com/webfiles/images/journals/lancet/s0140673606694919.pdf by Burnham _et al._ study estimates about 655,000 excess deaths in Iraq for the period of March 2003 to July of 2006, of which about 600,000 are directly attributable to violence — an appalling number. Right-wing reaction has been, understandably, that the 600,000 estimate is unbelievably high. (“Tim Lambert”:http://scienceblogs.com/deltoid/2006/10/flypaper_for_innumerates.php gives a roundup.) Convincing those critics who see this number and declare “that can’t possibly be right,” or “my gut says no” or “this doesn’t even pass the smell test” is difficult. This is partly because some will just think that any estimate that sounds bad must be false, and take refuge in old saws about lies, damned lies, and what have you. But it’s also partly because six hundred thousand violent deaths since the war began seems huge — and, frankly, it is. As “this typical guy”:http://gatewaypundit.blogspot.com/2006/10/new-liberal-death-count-claims-770.html says, that’s equivalent to 3 to 10 Hiroshima atomic blasts, 6 to 20 Nagasaki atomic blasts or 10 Dresden bombing campaigns. Yes, that’s right. Those events happened in a single day or over a very short period. The present estimate is for a large country of twenty six million people over three and a half years. Sadly, this means it’s quite achievable. As “Juan Cole”:http://www.juancole.com/2006/10/interview-with-rajiv-chandrasekaran.html points out, you just have to believe that four our five people a day are being shot or otherwise killed in each of Iraq’s major towns outside of Baghdad.

The incredulous ones will then say, “But that’s about 500 violent deaths a day over the period! Why hasn’t this been reported! “So, does this mean all of those headlines of 18 or 30 deaths were off by 700 or so?”:http://gatewaypundit.blogspot.com/2006/10/new-liberal-death-count-claims-770.html Inconceivable!” As David Lewis once said, it is hard to know how to refute an incredulous stare. If neither a careful reading of the study itself nor examples like Cole’s will do anything to make you doubt the cognitive power of your bowels, then there’s probably not much to be done. Consider this, though. Even small societies are big. And big societies are huge. Nearly two and a half million people die in the United States every year. Nearly seven hundred thousand people die of heart disease. Lots of things happen that you don’t hear about. I can say with confidence that about a hundred and fifteen people died in road accidents today in the U.S., as did yesterday, and will tomorrow, and the day after that. And about fifty people in the U.S. died today as the result of assault, and will again tomorrow. These numbers are accurate, but I don’t mean them as any kind of serious comparison. They’re just a catalyst for the imagination. Fifty in the U.S., five hundred in Iraq. The two countries are very different, but is it really so inconceivable that ten times as many people might be dying violently on any given day in Iraq than in the United States?

Attractive Models

by Kieran Healy on September 19, 2006

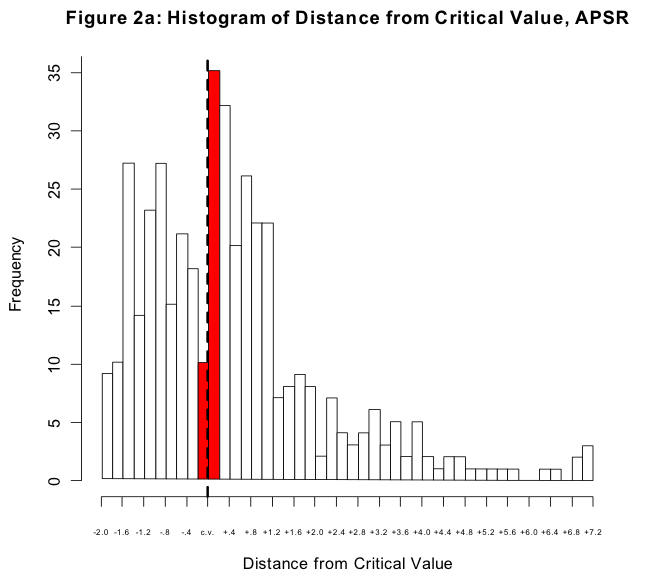
Via “Jeremy Freese,”:http://jeremyfreese.blogspot.com/2006/09/and-you-thought-astrosociology-was.html a paper by Alan Gerber and Neil Malhotra called “Can political science literatures be believed? A study of publication bias in the APSR and the AJPS.” Here’s the main finding.

[click to continue…]

The Logic of Yogic Discovery

by Daniel on July 27, 2006

As I posted over on one of my other blogs, one’s first reaction to this paper is horrified amusement that it got printed in a reasonably respectable journal. The authors are mainly from the faculty of “Maharishi University” and it’s a study of the efficacy in reducing the frequency of terrorist incidents in Israel and Lebanon of installing a group of people practising Transcendental Meditation. It is, to be honest, pretty whacky stuff, although my personal opinion is that the meditators get the best of the methodological debate which followed (really, the yogis were not pulling any statistical funny business and they did find a significant effect; it’s discussed in this rather good article on statistical methodology generally)

But really, who is in the wrong here?
[click to continue…]

Appropriate empirical evidence?

by Eszter Hargittai on July 3, 2006

An image of a man who is definitely not a college student (certainly not traditionally aged) accompanies an article called “Men Assume Sexual Interest When There May Be None” in a recent piece by a HealthDay reporter, a piece that’s been published on various Web sites. (In case of link rot, I’ve placed a screen shot here.)

In the sixth paragraph of the piece we find out that the study is based on 43 male and 43 female college students aged 18-22. That is the only part of the article where the participants are referred to as college students. Otherwise, the entire piece is about the behavior of men and women generally speaking.

There are several fields that base a good chunk of their empirical research on studies of students.* This is usually done due to convenience. And perhaps regarding some questions, age and educational level do not matter. But the issue is rarely addressed directly. In many instances it seems problematic to assume that a bunch of 20-year-olds in college are representative of the entire rest of the population. So why write it up that way then? At best, in the conclusion of a paper the authors may mention that future studies should/will (?) expand the study to a more representative sample, but these studies rarely seem to materialize.

This is one of my biggest pet peeves when it comes to certain types of scholarship. And I do mean scholarship. Because it is not just the journalistic reports that make the leap. The academic articles themselves use that kind of language. It is part of a larger question that’s been of interest to me for a while now: Historically, how have various fields settled on what is acceptable empirical evidence in their domain and what are the appropriate modes of analysis? Papers that get into top journals in one field wouldn’t even make it off the editor’s desk for review in another field due to the data and methods used. But then when it comes to reporting findings to the public, it all becomes one big general pool of work where the methods and the validity of the findings don’t seem to matter anymore.

[*] Note that recently I have been doing studies on college students myself. First, I have a concrete substantive reason for doing so (they are the most highly network-connected age group, which helps to control for regular use). Second, when I write up the work, I never draw huge generalizations about all users. I always report on “college students” or “study participants”. I do not simply conclude that whatever I find about college students is representative of all Internet users. It would be wrong to do so.

Data ain’t just for geeks anymore

by Eszter Hargittai on June 28, 2006

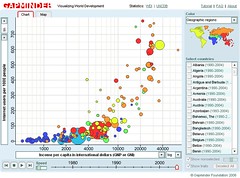
Via Jim Gibbon I’ve discovered Gapminder. Wow! It’s a wonderful visualization tool for data. The focus is on world development statistics from the UN. The tool is incredibly user-friendly and let’s you play around with what variables you want to see, what you want highlighted in color, whether you want to log the data, what year you want to display, and whether you want to animate the time progression (oh, and how quickly).

I’ve made an example available on YouTube. (I used Gapminder to create the visualization and Hypercam to capture it.)

Here is some context for that particular graph. My first interests in research on Internet and social inequality concerned the unequal global diffusion of the medium. I wrote my senior thesis in college on this topic and then pursued it further – and thankfully in a more sophisticated manner – in graduate school. So this is a topic that has been of interest to me for a while and it’s great to be able to play with some visual representations of the data.

So what you have on the video graph is a look at Internet diffusion by income (logged) from 1990-2004. I picked color coding by income category, which is somewhat superfluous given that the horizontal access already has that information, but I thought it added a little something. (For example, to summarize the puzzle of my 1999 paper – the first to run more than bivariate analyses on these data -, it focused on explaining why all the red dots are so widely dispersed on the graph despite all representing rich long-term democratic countries.)

Thanks to the tool’s flexibility, you can change it so that the color coding signifies geographical region and could then tell immediately that what continent you are on – an argument some people in the literature tried to make – has little to do with the level of Internet diffusion.

Gapminder example

Imagine the possibilities of all this in, say, classroom presentations. Jim links to a great presentation using this tool. (Although I disagree with the presenter’s conclusion at the end about the leveling of differences regarding Internet diffusion.)

I recommend checking out the tool on your own for maximum appreciation of its capabilities.

UPDATE: There is more! Conrad – Jim’s source on this – tells me that the tool on the Trendalyzer site has even more option. Moreover, you can download a beta version of the software that even lets you import your own data.

Bloggers on survey findings

by Eszter Hargittai on June 16, 2006

Rob Capriccioso of Inside Higher Ed reports on what Glenn Reynolds of InstaPundit, Markos Moulitsas Zúniga of Daily Kos and Jessica Coen of Gawker think about college students’ lack of interest in political blogs and Beltway gossip.

While I appreciate that they are happy with students spending their time on things other than politics, their responses ignore the fact that students do follow news, they just don’t do so on political blogs. All of the responses present time spent on these blogs as competition for time spent having fun with friends. However, findings from the survey suggest that students do follow current events (59% look up local or national news daily or weekly; 44% look up international news that frequently) so it’s not as though students only care about sex and beer. Granted, the survey doesn’t ask about the specific type of news they follow, but chances are that some of the material overlaps with topics covered on these blogs.

Additional info in the article includes my response to the inevitable question: “What about porn?”.

Wanting to Know Everything

by Kieran Healy on May 11, 2006

The NSA “has assembled”:http://www.usatoday.com/news/washington/2006-05-10-nsa_x.htm a gigantic database of telephone calls in the United States, with the help of all of the major telecommunications providers (except Qwest). The database is not of voice recordings, but of calls made. It constitutes data on a huge network of ties between people who call each other. In recent years, sociology and related fields have seen a lot of development in dynamic modeling of social networks, and in fast algorithms for analyzing large, sparse graphs. Entities with this kind of structure include things like the Internet, or AOL’s instant messenger network, and the universe of telephone calls within the United States. Some of the papers in “this edited volume”:http://darwin.nap.edu/books/0309089522/html/, published by the National Academy of Science, give a sense of what people are doing. (The volume was co-edited by my colleague “Ron Breiger”:http://www.u.arizona.edu/~breiger/.) For instance, you can read about “Data Mining on Large Graphs”:http://darwin.nap.edu/books/0309089522/html/265.html, “Identifying International Networks”:http://darwin.nap.edu/books/0309089522/html/345.html, the “Key Player Problem”:http://darwin.nap.edu/openbook/0309089522/html/241.html, and the use of “MTML models to study adversarial networks.”:http://darwin.nap.edu/books/0309089522/html/324.html I think it’s fair to say that techniques of this sort are of significant interest to the intelligence community.

Social scientists, in the normal course of things, are severely limited in the amount of good data they can collect on networks of this sort. The “Internet Movie Database”:http://www.imdb.com has proved a very useful source of data for developing theory and methods in this area because it’s comprehensive and publicly available. Other researchers have set out to collect very large datasets describing some network structure together with the attributes of the people in it. A recent paper by “by Gueorgi Kossinets and Duncan Watts”:http://www.sciencemag.org/cgi/content/abstract/311/5757/88, for example, analyzes all the emails sent over the course of a year by 43,000 students, faculty and staff at a large private university. But the traffic analyzed in that paper is just a drop in the ocean of the real flow of communication that travels by voice and email every day.

Social network analysts — in fact, any social scientist who works with quantitative data — often dream of ideal datasets. The kind of thing we would collect if money, time and ethics did not constrain us. When we daydream like this, our thoughts tend toward harmless megalomania: maximally comprehensive data on the whole population of interest, in real-time, with vast computing power to analyze it, and no constraints on updating or extending it. “And a pony”:http://examinedlife.typepad.com/johnbelle/2004/03/if_wishes_were_.html, too. At the limit, something like “Borges’ map”:https://notes.utk.edu/bio/greenberg.nsf/0/f2d03252295e0d0585256e120009adab?OpenDocument is what we want, a perfect, one-to-one scale representation of the world.

Scientists and spies are not so different. The intelligence community’s drive to find the truth, to uncover the real structure of things, is similar to what motivates natural or social scientists. For that reason, I can easily understand why the people at the NSA would have been drawn to build a database like the one they have assembled. The little megalomaniac that lives inside any data-collecting scientist (“More detail! More variables! More coverage!”) thrills at the thought of what you could do with a database like that. Think of the possiblities! What’s frightening is that the NSA is much less constrained than the rest of us by money, or resources, or — it seems — the law. To them, Borges’ map must seem less like a daydream and more like a design challenge. In Kossinets and Watts’ study, the population of just one university generated more than 14 million emails. That gives you a sense of how enormous the NSA’s database of call records must be. In the social sciences, Institutional Review Boards set rules about what you can do to people when you’re researching them. Social scientists often grumble about IRBs and their stupid regulations, but they exist for a good reason. To be blunt, scientists are happy to do just about anything in the pursuit of better knowledge, unless there are rules that say otherwise. The same is true of the government, and the people it employs to spy on our behalf. They only want to find things out, too. But just as in science, that’s not the only value that matters.
Replication of results

by Henry Farrell on April 20, 2006

“David Glenn”:http://chronicle.com/temp/email2.php?id=6hgvqc2HFwsqxHk6nBBz6Xq5WmmWzzkx has another article of topical interest today; the best write-up so far of the recent twists and turns in _l’affaire Lott_.

bq. Last week Mr. Lott filed a defamation lawsuit against Steven D. Levitt, a professor of economics at the University of Chicago … Mr. Lott charges that in the book and in private e-mail messages, Mr. Levitt spread lies about the quality and integrity of Mr. Lott’s work (The Chronicle, April 13). Much will hinge on exactly what Mr. Levitt meant by the words “replicate” and “peer refereed.” … Mr. Lott’s lawsuit comes at a time when Mr. Levitt is riding high; Freakonomics has sold more than one million copies. Mr. Lott, meanwhile, is in transition; on April 3, one week before he filed the lawsuit, he abruptly left his position as a resident scholar at the American Enterprise Institute, where he had worked since 2001. He did not answer The Chronicle’s inquiries about where he would go next. A representative of the institute declined to characterize the reasons for Mr. Lott’s departure, citing a policy against discussing personnel matters. …”The term ‘replicate’ has an objective and factual meaning in the world of academic research and scholarship,” the lawsuit reads. “When Levitt and Dubner allege that ‘other scholars have tried to replicate his results,’ the clear and unambiguous meaning is that ‘other scholars’ have analyzed the identical data that Lott analyzed and analyzed it the way Lott did in order to determine whether they can reach the same result.” … It is far from clear, however, that “replicate” is in fact consistently used by social scientists in the way Mr. Lott and Mr. Moody say it is used.

There’s also a second allegation that Levitt, in a private email, said that a special issue edited by Lott wasn’t peer-reviewed – but it’s hard for me to imagine how this allegation could be libellous. And on the question of the meaning of replication – I’ve always understood it in the wider, more ambiguous sense that Levitt appears to have been using it in. That said, I’m a political scientist (one of the economists quoted in the _Chronicle_ piece says that political scientists and economists use the term in different ways). I’d be astonished if this ever gets to trial, but if by some bizarre chance it does, it should make for some entertaining arguments about the nuances of the social science lexicon.

Tim Lambert, naturally, has more, “here”:http://scienceblogs.com/deltoid/2006/04/what_does_replicate_mean.php, “here”:http://scienceblogs.com/deltoid/2006/04/ted_frank_on_lott_vs_levitt.php, and “here”:http://scienceblogs.com/deltoid/2006/04/chronicle_on_lott_vs_levitt.php.

Against Schmidtz — for equality

by Chris Bertram on March 10, 2006

[This post is co-written by Harry and Chris and is an extended follow up to Chris’s “initial response”:https://crookedtimber.org/2006/03/06/cato-on-inequality/ to David Schmidtz’s Cato Unbound piece “When Equality Matters”:http://www.cato-unbound.org/2006/03/06/david-schmidtz/when-equality-matters/ .]

We live in a highly unequal world and in strikingly unequal societies. The income discrepancies between the global poor and those in wealthy societies are enormous, with around one quarter of the world’s population living on less than $1 US per day, and many suffering from acute malnourishment, disease and premature death.[1] (For some further details see articles by Thomas Pogge “here”:http://www.onlineopinion.com.au/view.asp?article=3717 and “here”:http://portal.unesco.org/shs/es/file_download.php/9c2318f24653a2a4655347d827f144acPogge+29+August.pdf .) But even within the very wealthiest societies great wealth coexists with severe poverty. Moreover, this is not simply an inequality in outcomes. Whilst the United States, for example, likes to imagine itself as a land of opportunity, social mobility is extremely low and in recent years the benefits of economic growth have been ever more concentrated in the very richest sectors of the population. According to one study, only 1.3 per cent of children born to parents in the bottom 10 per cent of income earners end up in the top 10 per cent. By contrast, almost a quarter of children born into the top 10 per cent stay there, and almost half stay in the top 20 per cent. Children born into the richest tenth of households are 18 times more likely than children born into the poorest tenth to end up in the top tenth. (Further see the “Economist”:http://www.economist.com/world/na/displayStory.cfm?story_id=3518560 and “Samuel Bowles and Herbert Gintis”:http://www.umass.edu/preferen/gintis/intergen.pdf .)

David Schmidtz’s recent piece for Cato Unbound, “When Inequality Matters”:http://www.cato-unbound.org/2006/03/06/david-schmidtz/when-equality-matters/ is an artful and unnerving attempt to make use of some recent work within egalitarian political philosophy to argue against what we what we think of as the core of egalitarianism: the demands for greater equality of condition and opportunity. We are not convinced. In our view Schmidtz’s case neglects the impact that relative inequalities have on absolute levels of flourishing and depends at crucial points on dubious analogies and on muddying important distinctions. But it would be churlish not to acknowledge that he gets some things right. For instance, he is correct to emphasize that we must identify the dimensions in which equality matters, for the basic reason that making people equal on one dimension will often have the simple effect of making them unequal on another. Equalizing incomes, for example, would leave people unequal in well-being, because different people have different capacities to convert their income into well-being.

[click to continue…]

Good Old John Lott

by Kieran Healy on February 7, 2006

Don Luskin may be the “stupidest man alive”:http://www.j-bradford-delong.net/movable_type/2005-3_archives/000216.html, but this is small beer compared to John Lott, whose career strives to maximize a three-variable function defined by stupidity, error and sheer bad faith. Whenever you think there are regions of this space that he could not possibly explore further, “he proves you wrong”:http://scienceblogs.com/deltoid/2006/02/lotts_correction_policy.php.

World Values Survey

by Henry Farrell on December 14, 2005

I’ve just discovered when poking around for some figures that you can now analyse data from the “World Values Survey”:http://www.worldvaluessurvey.org/ online. This is a very neat tool, not only for political scientists and sociologists, but for anyone else who’s interested in getting basic information on attitudes in different countries to politics, society and religion. You don’t have to be a stats wizard to play around with the numbers. As far as I’m aware, the Survey is outstandingly the most comprehensive database of its kind.

In other news, Sam Rosenfeld points in comments to an interesting “response”:http://www.emergingdemocraticmajorityweblog.com/donkeyrising/archives/001317.php to the Bartels paper that I “blogged”:https://crookedtimber.org/2005/12/12/not-in-kansas-anymore/ a couple of days ago. According to David Gopoian and Ralph Whitehead, whether Bartels is right depends on how you define the white working class, and Bartels, by their books, is working with a non-standard definition. Bartels talks a bit in the paper about definitional questions, but it would be interesting to know what his counter-response would be.

Dear oh dear

by Chris Bertram on November 23, 2005

Norman Geras has a “little post on inequality today”:http://normblog.typepad.com/normblog/2005/11/deeply_wrong.html . I’m happy to report that Geras still believes that inequality is a bad thing. However, he can’t let the matter go without writing a few lines directed at those whom he sees as America’s detractors, who made a fuss about the inequality exposed by Hurricane Katrina despite the manifest inequalities of their own societies.

bq. As if the issue was somehow absent before Katrina, isn’t with us continuously. Or as if it was an issue specific to America, and not a general feature of capitalist societies – in which the circumstances of many people’s lives are permanently of a sort that it would horrify others luckier and more privileged to be plunged into.

Well, yes, all capitalist societies _are_ unequal societies. But they are not unequal to the same degree, and among advanced capitalist societies the United States happens to be a significant outlier. Taking the “Gini coefficient as an indicator”:http://www.nationmaster.com/graph-T/eco_dis_of_fam_inc_gin_ind&int=-1 , the US comes in with a score of 45 with other “anglosphere” countries being closest to it among developed countries. Moreover the US does very badly compared to those other countries on measures such as the UN’s Human Poverty Index (17th out of 18 selected OECD countries in in the “2005 report”:http://hdr.undp.org/reports/global/2005/pdf/HDR05_HDI.pdf (pdf) , p. 231). So emphasising America’s peculiar position is not, contra Geras, an indication of irrational anti-Americanism but a reflection of the harsh facts.