Over on the Edge of the American West, Eric has been working up some graphs on what the WPA spent its money on. Data visualization nerdery is below the fold. The rest of you can go back to your pie charts, whether in honest ignorance or a spirit of desperate contrarianism.
Eric’s own presentation of the data showed clearly that the WPA spent much more of money on highways roads and streets than anything else — so much so, in fact, that graphing it directly obscured some of the variation across the other categories. There was some discussion. My own view in that conversation was (a) that dotplots were preferable to barcharts, and, more substantively, (b) that if you wanted to hone in on the smaller categories, it would be easiest to graph them separately, having established “Highways, roads and streets” as the predominant focus of spending.
But there’s always the temptation to try to capture everything at once, and clearly. So Duncan Agnew followed up with a very nice bit of work that took advantage of two colors to plot two scales on a dotplot, one to show the main distribution (on a billion-dollar scale) and one to better show the smaller categories (in millions of dollars). Dogmatism about principles of data visualization is no great virtue, and Duncan shows that you can break the rule that you shouldn’t have two scales on the same axis and still have a readable chart. But what if we wanted not to break the rule, and plot only one series? In that case the obvious thing would be to take the log of the data to bring the observations more neatly into line. The cost is that you lose the initial point of the exercise, which was to show how much more spending there was on roads than on any other category. But those detail-obsessed historians wanted to be able to see the fine grain of the other kinds of expenditure. So maybe the thing to do is to artificially partition the graph into panels based on the order of magnitude of spending, plot the range within each order of magnitude, with header at the top of each panel to remind the reader what sort of scale they are looking at. That way we can see the detail of the smaller categories without wholly forgetting they are very much smaller than the largest. And here it is:
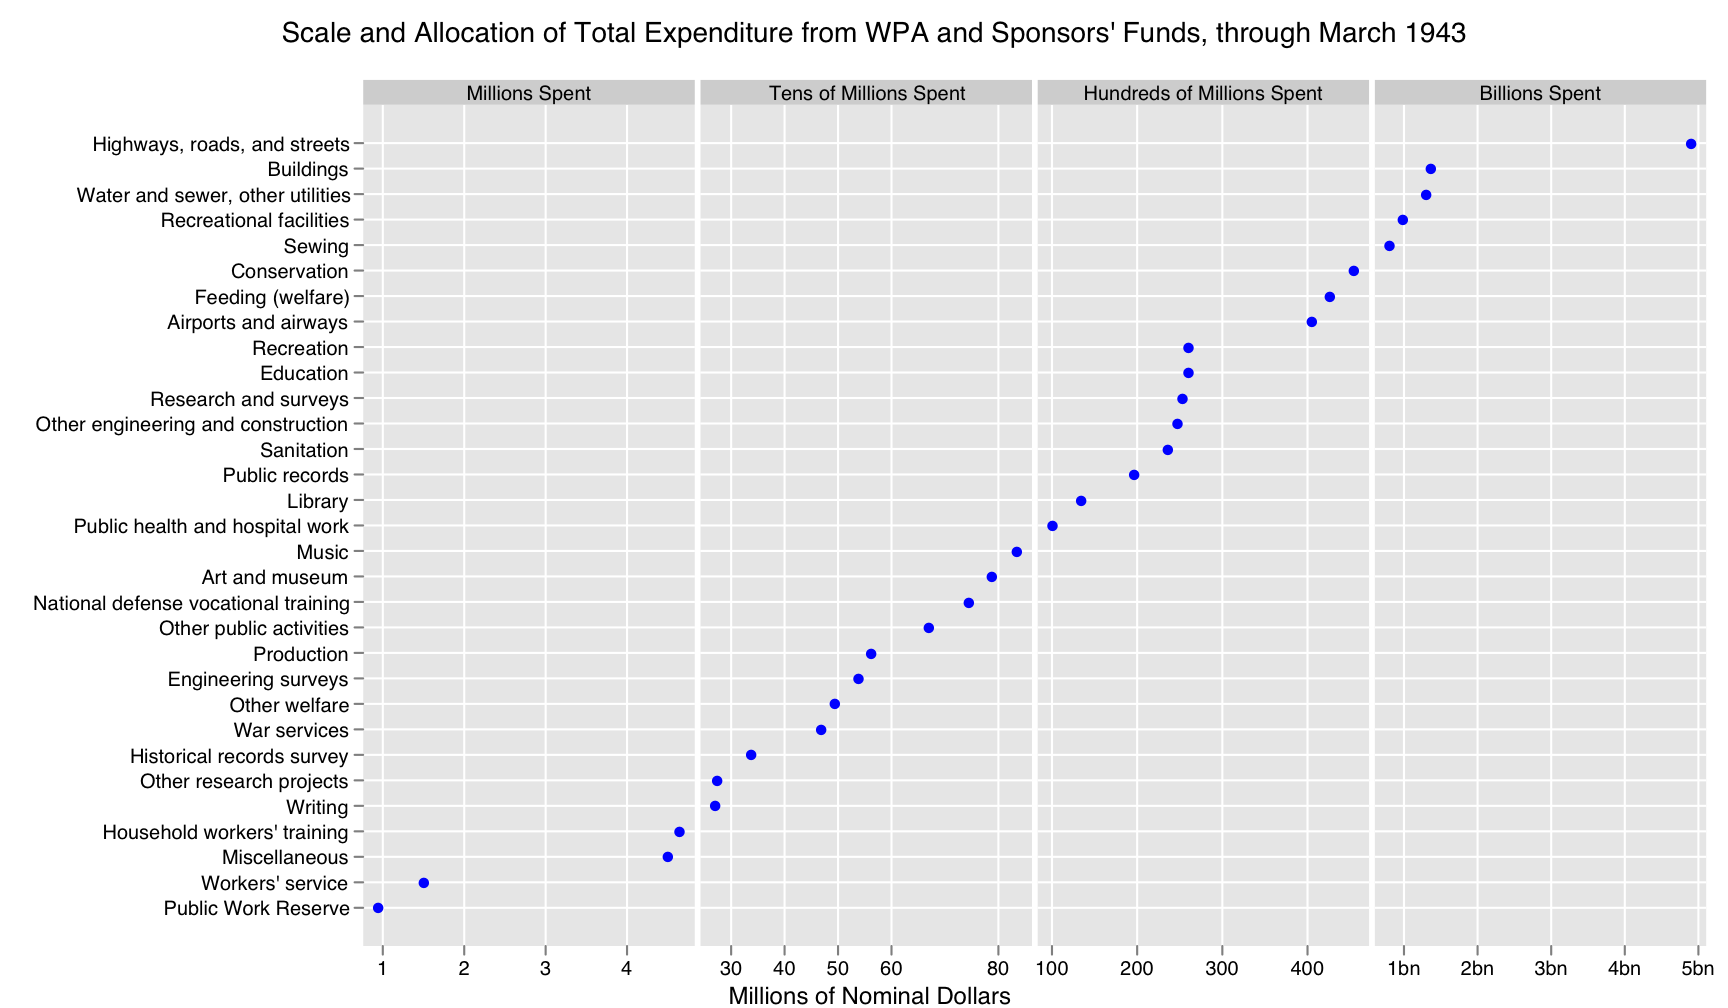
Click on the image for a closer look, or click here for a nicer PDF version.
In effect, what I’ve done here is choose to break a different rule from Duncan. Instead of putting two scales on the same axis, I have made one axis discontinuous between panels, skipping values in order to compress the horizontal size. Hence the reminder at the top of each panel that you’re shifting up an order of magnitude each time. Despite the rulebreaking, there’s still some principle at work because instead of just putting a discontinuity right at the end (to incorporate the largest value) the panels are split consistently by powers of ten, and it makes sense to think of WPA expenditures as falling into groups like “stuff they spent billions on” versus “stuff they spent tens of millions on” or “stuff they only spent a few million dollars on” and so on. I think it works OK, though of course as always these choices depend on judgments about presenting the data honestly and clearly making the point you want to convey. Bear in mind that this is just one-dimensional data. It’s striking how complex even quite simple data can be to present effectively.
{ 31 comments }
apthorp 01.03.09 at 5:53 am
why not just a log scale?
it “smells” like a power law, but how does that involve the categories? Is there some organizational principle at work here? Assuming categories track management structure and that each manager has some reasonable number of direct reports, then at each level there can be a few direct reports managing “big” projects in a “fixed” category (e.g. roads) or closely related areas and some general purpose managers managing “mixed” categories. It would be amusing to work out the model and see if you could predict the organizational parameters (# of direct reports, fraction of fixed/mixed), and compare that to the actual structure.
note I’m way out of my zone on the historical/economic particulars here, so all this may be total crap or completely obvious to the casual observer. :)
Colin Danby 01.03.09 at 6:13 am
Trouble is that the fineness or coarseness of the spending categories is quite arbitrary — in part, you are graphing someone else’s lump/split decisions. I would keep the original linear scale to make the large point about roads etc., and then go to a table for anything more precise — anyone “detail obsessed” will demand the underlying data anyway, no? In a hypertexted world it’s not as though you have to choose one or the other due to space constraints.
peter 01.03.09 at 9:27 am
Why should there be “rules” for visualization of data? As with any other form of communication, the most appropriate form of data presentation depends on the audience to which it is addressed and the context of the communication, so the whole idea of there being generic (non-audience-specific) rules makes no sense.
peter 01.03.09 at 9:32 am
” Duncan shows that you can break the rule that you shouldn’t have two scales on the same axis”
Presumably, Nomograms should never have been invented, let alone used.
James Wimberley 01.03.09 at 11:42 am
Peter’s broken link should I think go here.
BTW, is there a word for an empty Wikipedia page? A wik’ole? (I looked up “nothing” in this online Hawaiian dictionary.)
Kieran Healy 01.03.09 at 12:55 pm
why not just a log scale?
That’s almost what it is. In the original discussion people were looking for a stronger way to remind the viewer about the scale changes in such a case.
it “smells†like a power law
I wouldn’t say that.
Trouble is that the fineness or coarseness of the spending categories is quite arbitrary—in part, you are graphing someone else’s lump/split decisions. I would keep the original linear scale to make the large point about roads etc., and then go to a table for anything more precise—anyone “detail obsessed†will demand the underlying data anyway, no?
This was more or less my original point in the EOTAW thread, which was that there wasn’t a third variable or a rationale internal to the categories that would let you reorganize them cleanly into panels. But I wanted to see if I could do something with it anyway.
Why should there be “rules†for visualization of data?
Because there are more and less effective ways of presenting data.
Presumably, Nomograms should never have been invented, let alone used.
I’ve used nomograms myself when presenting regression results. They’re good, especially for getting across differences in the substantive significance of statistically significant effects.
peter 01.03.09 at 1:25 pm
Kieran:
“Because there are more and less effective ways of presenting data.”
Sigh. This statement only has meaning given an intended audience and given a context for the intended communication event. Effective for whom? Effective for what purpose?
Has the last two centuries of writing on the philosophy and sociology of language been in vain, I wonder.
Kieran Healy 01.03.09 at 1:38 pm
Sigh. This statement only has meaning given an intended audience and given a context for the intended communication event. Effective for whom? Effective for what purpose?
I say above that “Dogmatism about principles of data visualization is no great virtue” and “as always these choices depend on judgments about presenting the data honestly and clearly making the point you want to convey”, which makes it quite clear that I think presenting data well entails many context-specific considerations flowing from whatever conversation is going on, and the ends to which it’s aiming. Indeed, this entire exercise got off the ground because someone asked “Can you present this data in a way that lets me see this and this other thing at the same time?” So it’s a bit irritating to have someone getting all “Sigh” on you about the importance of context and intention in communicative events when they don’t seem to have bothered to read the original post all the way through.
Alex 01.03.09 at 2:04 pm
Suggestion – could you use a different colour background for each of the progressively bigger sub-scales, so as to make it visually intuitive that something is changing between each one? Or perhaps make the backgrounds of each one cover different areas?
peter 01.03.09 at 2:16 pm
Given what you claim in comment #8 is the argument in your post, how you could possibly write what you did in comment #6?
“Because there are more and less effective ways of presenting data.”
Both of us, it seems, are irritated. My irritation is with people who consider there to be such things as generic rules for communicative acts without regard to audience or context, despite all the evidence against such such things. Perhaps this group of people does not include you, but your statement in comment #6 led me to think otherwise.
Chad Orzel 01.03.09 at 3:01 pm
The one problem I see is that the labels at the top can create confusion regarding the labels at the bottom. When I first glanced at the right-hand panel, I briefly thought that it was saying that the WPA had spent $5,000 BILLION dollars on roads, not $5,000 million, because I wanted to apply the label at the top to the label on the bottom. The correct unit label is two panels away to the left, while the upper label saying “Billions” is right there.
The basic idea isn’t that bad, but I think you’d be better off doing the bottom labels differently– changing the rightmost panel to $1 Billion, $2 Billion, etc.
As noted above, of course, this depends a great deal on the intended audience.
Kieran Healy 01.03.09 at 4:43 pm
The basic idea isn’t that bad, but I think you’d be better off doing the bottom labels differently—changing the rightmost panel to $1 Billion, $2 Billion, etc.
Yeah, I just fixed that.
As for changing the background color or (better) the width of the panels, this could certainly be done, and I thought about those options, but it’d require a bit more programming than I have time for right now.
grackle 01.03.09 at 5:32 pm
I’ve nothing but admiration for your graph. Perhaps that is because I struggled with the two previous iterations and thus find myself as the perfect intended audience. Thanks, good work.
Barry 01.03.09 at 7:30 pm
apthorp 01.03.09 at 5:53 am
” why not just a log scale?”
Because the major point in the graph was that a few categories dominated the spending. Note that grouping a bunch of the low-spending groups wouldn’t change that much.
Going to a log scale would, for the most part, hide that message. Only those used to interpreting log scale graphs would grasp that, and probably only on the third or fourth view.
Barry 01.03.09 at 7:33 pm
I would add that the discussion of the New Deal over at Edge of… is very informative; we’re seeing another outbreak of the old ‘the New Deal prolonged the Great Depression’ lie, so it’s good to have a source of actual information.
ehj2 01.03.09 at 10:47 pm
I think an excellent graph — but I’m not sure about $1B of “Sewing” (two levels beneath “Water and Sewer and Other Utilities”) …
Hadley 01.03.09 at 11:05 pm
Maybe you want facet_grid(…, shape = “free”)? I’m guessing you’re using a custom breaks and labels argument for the x axis, rather than modifying it afterwards. (It looks like you missed 70)
Charles S 01.04.09 at 12:34 am
I think it would be better without the discontinuity in the upper hundred millions. I don’t think that there is anyone who will correctly read your chart to say that sewing had twice the expenditure as conservation, and that the discontinuity between recreation and airports is only half the size of the discontinuity between sewing and conservation. I do like the idea of breaking the graph up into linear sections based on orders of magnitude (instead of a log scale), particularly for a non-science audience, but I think that introducing discontinuities at the shifts in scale creates more confusion rather than simplicity.
Even after noticing the discontinuity at Sewing, I had almost finished this comment and was just looking at the chart again when I noticed that writing (just below $30 million, and arbitrarily at the bottom of the tens of millions category) received more than 5 times what Household workers training received (just over $4 million and arbitrarily at the top of the millions category), even though the two dots are very close together.
The idea of adding headers naming each order of magnitude is very nice, and would work well with a true log scale as well.
Kieran Healy 01.04.09 at 2:11 am
Hi Hadley,
Maybe you want facet_grid(…, shape = “freeâ€)?
The basic plot is an object with custom breaks which is then built up first with geom_point() and then facet_grid(. ~ Order, scale=”free”), where Order is the factor that distinguishes the panels (“Millions”, “Tens of Millions” etc). If I substitute shape=”free” instead, I get an error:
Error in get(“new”, env = FacetGrid, inherits = TRUE)(FacetGrid, …) :
unused argument(s) (shape = “free”)
The full code is:
llabs < -c("1","2","3","4","30","40","50","60", "80","100","200","300","400","500","1bn","2bn","3bn","4bn", "5bn") p <- ggplot(data, aes(Spending, reorder(Category,Spending))) + scale_y_discrete(name=" ") + scale_x_continuous(name="Millions of Nominal Dollars", breaks=c(1,2,3,4,30,40,50,60,80,100,200,300,400,500,1000,2000,3000,4000,5000),labels=llabs) + geom_point(colour="blue",size=2.5) p + facet_grid(. ~ Order, scalee="free") + opts(axis.text.y=theme_text(colour="#000000",hjust=1), axis.text.x=theme_text(colour="#000000",vjust=1)) + opts(title="Scale and Allocation of Total Expenditure from WPA and Sponsors' Funds, through March 1943\n")
Without the custom breaks (which aren’t ideal) I found some ticks being repeated on adjacent panels. Is there a a way to control the width of separate panels, or would that entail constructing completely different objects one at a time?
(For the rest of you following along, Hadley is the author of the R package that does all the heavy lifting in this graph.)
Hadley 01.04.09 at 4:24 am
You’d think I’d be able to remember the arguments to my own code – it’s space not shape. But thinking about it more, it won’t work, because it would just reproduce the original plot with the billions dwarfing the smaller numbers. There probably should be some way to specify per facet labels, breaks and limits, but I haven’t come up with a clean way of doing it yet.
For this chart you could perhaps use
geom_blankto add a dummy dataset and layer that pushed out the limits of the individual scales – that would ensure that you at least had consistent scales across the different orders of magnitude.Hadley 01.04.09 at 4:28 am
p.s. it’s really nice to see ggplot2 in the “wild” :)
Kieran Healy 01.04.09 at 4:36 am
But thinking about it more, it won’t work, because it would just reproduce the original plot with the billions dwarfing the smaller numbers.
Yes, I was just in the process of writing up a comment to that effect — I should have realized it myself, as I’d tried it already yesterday and that’s exactly what happened.
For this chart you could perhaps use geom_blank to add a dummy dataset and layer that pushed out the limits of the individual scales – that would ensure that you at least had consistent scales across the different orders of magnitude.
I’ll check it out.
p.s. it’s really nice to see ggplot2 in the “wild†:)
It’s a great package — thanks for writing it. An earlier effort in the same vein as this one is here. I’m much more used to the lattice framework, so it’s taken me a bit of time to get used to the ggplot approach (which is also one of the reasons I mess around with this sort of data — to learn the syntax). The new version of the book is very helpful, btw.
MQ 01.04.09 at 5:28 am
“sewing”?
andrew cooke 01.04.09 at 11:44 am
i think it’s a disaster, to be honest.
first, the scales have been chose so that the blue dots form a “line” across category boundaries. that means that a first glance shows an almost flat rise when, in fact, there are different scales involved (agnew’s plot shows the actual structure much more clearly). in other words, structure in the data has been purposefully(!) hidden by the careful choice of scale boundaries (an apparently straight line across different scales does smell – misleadingly – like a power law).
second (in a sense the same point repeated), there’s no single zero point for the x axis. there’s no way of seeing that one point is worth twice another, even within the same scale, until you go look at the numbers.
i find it particularly depressing because it imitates tufte while ignoring the basic principles behind his work. the point is not that something look simple, but that it actually is simple. agnew’s plot loses (slightly) on the “style” stakes, but more than makes up by being faithful to the original data. clarity of presentation must emerge from clarity of thought; arranging things in an ad-hoc manner to make them look simple is – well, you must know, in your heart of hearts, that this sucks deeply?
salient 01.04.09 at 6:27 pm
My irritation is with people who consider there to be such things as generic rules for communicative acts without regard to audience or context, despite all the evidence against such such things.
Says the person who is writing in grammatically appropriate sentences, which obey generic rules for the communicative act of writing. Or in a different context, would you have said rriiion aymt pswiht audnlascoa and expected to have gotten your point across all the more efficiently? Being a human being, communicating to other human beings who share a common language, implies enough context to start making at least rudimentary judgments about efficiency.
That having been said, the panel discontinuity of this graph is an excellent tweak. What a log scale tends to mask, this clarifies pretty well. I still get the immediate impression of what spending dwarfs what other spending, and I can compare two values relatively easily.
that means that a first glance shows an almost flat rise when, in fact, there are different scales involved
…in general, for this kind of data, we’re not trying to determine whether there’s a linear or cubic or what-have-you relationship between points. We’re comparing quantities that in some sense are not determined by one another. People who aren’t scientists and don’t work frequently with models themselves won’t make the immediate association between an approximate-linear graph and the rather sophisticated notion of slope. You look at this graph and you see roads all by itself, in a block set aside all for itself: you get the idea that spending on roads dwarfs nearly everything else. It’s not as skull-crushingly obvious “at first glance” as a basic log scale, but Kieran’s striking a balance.
It’s striking how complex even quite simple data can be to present effectively.
I’d have preferred: 1, more room between each continuous block. 2, that billions be expressed as thousands of millions along the horizontal axis (the use of 1bn, 2bn, etc was a little ill-advised). Other than those minor aesthetic tweaks, this presentation seems very effective.
Zamfir 01.05.09 at 10:29 am
I am afraid I have to agree with Andrew Cooke here, I think this solution introduces more problems than it solves. Your plot hides two jumps below 30 million and below 1 billion, suggesting a straight line that does not exist at all. Even more confusingly, the break at 100 million does not hide a jump to the same extent as the other breaks do.
As such, i think I like Agnew’s solution more, also because it warns more clearly that it uses a “non-standard” way of plotting. If you really want to do it in your way, I would make at most one break and make the white-space between them a lot larger. Perhaps you can also introduce horizontal whitespace?
My own solution to these kinds of situations is to use the small map/large map trick from newspapers: I make two graphs, and draw (in an external drawing program) a thick rectangle around the part of the billions-graph that goes on to be the millions-graph.
Zamfir 01.05.09 at 10:51 am
Apologies for the double-post, I thought a bit more about it… The thing is, I am wondering whether a simple table with numbers would not be more effective than this particular graph. The advantages of a graph over table would be that you can visually compare magnitudes, and that patterns such as breaks are clearly visible.
But this particular graph makes visual comparison impossible without looking up the actual numbers on the scale, and the breaks and their relative importance are only noticable if you study the graph really well. If you just printed the numbers, the larger number of digits would show the breaks at least as clear as this graph.
lemuel pitkin 01.05.09 at 3:42 pm
I have to agree with Zamfir and Andrew Cooke. But I’d like to hear Kieran’s response.
My impression:
At first glance, the graph seems to say that there were spending categories distributed more or less evenly across the whole range of spending levels, with roads only a modest outlier. Second glance, you notice the key up top and think it’s a straight line on a log scale. Naturally, you expect a horizontal increment under “hundreds of millions” to be ten times as much as one under “tens of millions”. But no, that’s not the case either. Or is it that the items in the same panel are comparable in size, with each white space representing an order-of-magnitude break? But no, the middle break isn’t really a break at all.
As far as I can tell, the visual impression given by the graph — the smooth slope of the points — just has no relationship to the underlying data at all. So what’s the advantage of this presentation over a simple table? or over Agnew’s double graph?
lemuel pitkin 01.05.09 at 3:49 pm
Or to put it a little more shaprly — by arbitrarily adjsuting the horizontal scale, you can give a curve like this whatever shape uyou want. But what does a graph tell you about the underlying data when its shape is simply imposed by hand?
Kieran 01.05.09 at 7:13 pm
I take the point about the panel transitions being problematic. I think I’m leaning back toward my original view that two separate graphs would be a better way to do it. In a way, a table with the full dollar amounts would work fine, as reading the extra zeros conveys the different magnitudes in the most compact way.
michael e sullivan 01.05.09 at 10:02 pm
“why not just a log scale?”
That’s almost what it is. In the original discussion people were looking for a stronger way to remind the viewer about the scale changes in such a case.
I would say you’ve made a weaker way. It’s not at all obvious that the scale is discontinuous visually — you have to read the fine print.
If you are going to graph it this way, I greatly prefer larger breaks between the categories plotted on different scales, both horizontally and vertically, also different colors used for the dot plots at different scales would also serve to alert the viewer that something is going on. It’s extremely difficult to visualize from your graph, the difference at the boundary of the scales.
There appears to be a bigger difference between recreation and airports/airways, than between conservation and sewing, where the plots are right next to each other.
That would be somewhat alleviated by more obvious visual breaks, but a simple log scale would avoid the problem completely while conveying at least as much visual information as this graph.
I prefer the log scale. or, as your last comment suggests, a table with full dollar amounts (or amounts in thousands/millions) which would make the arithmetical differences clearer without losing information.
Comments on this entry are closed.