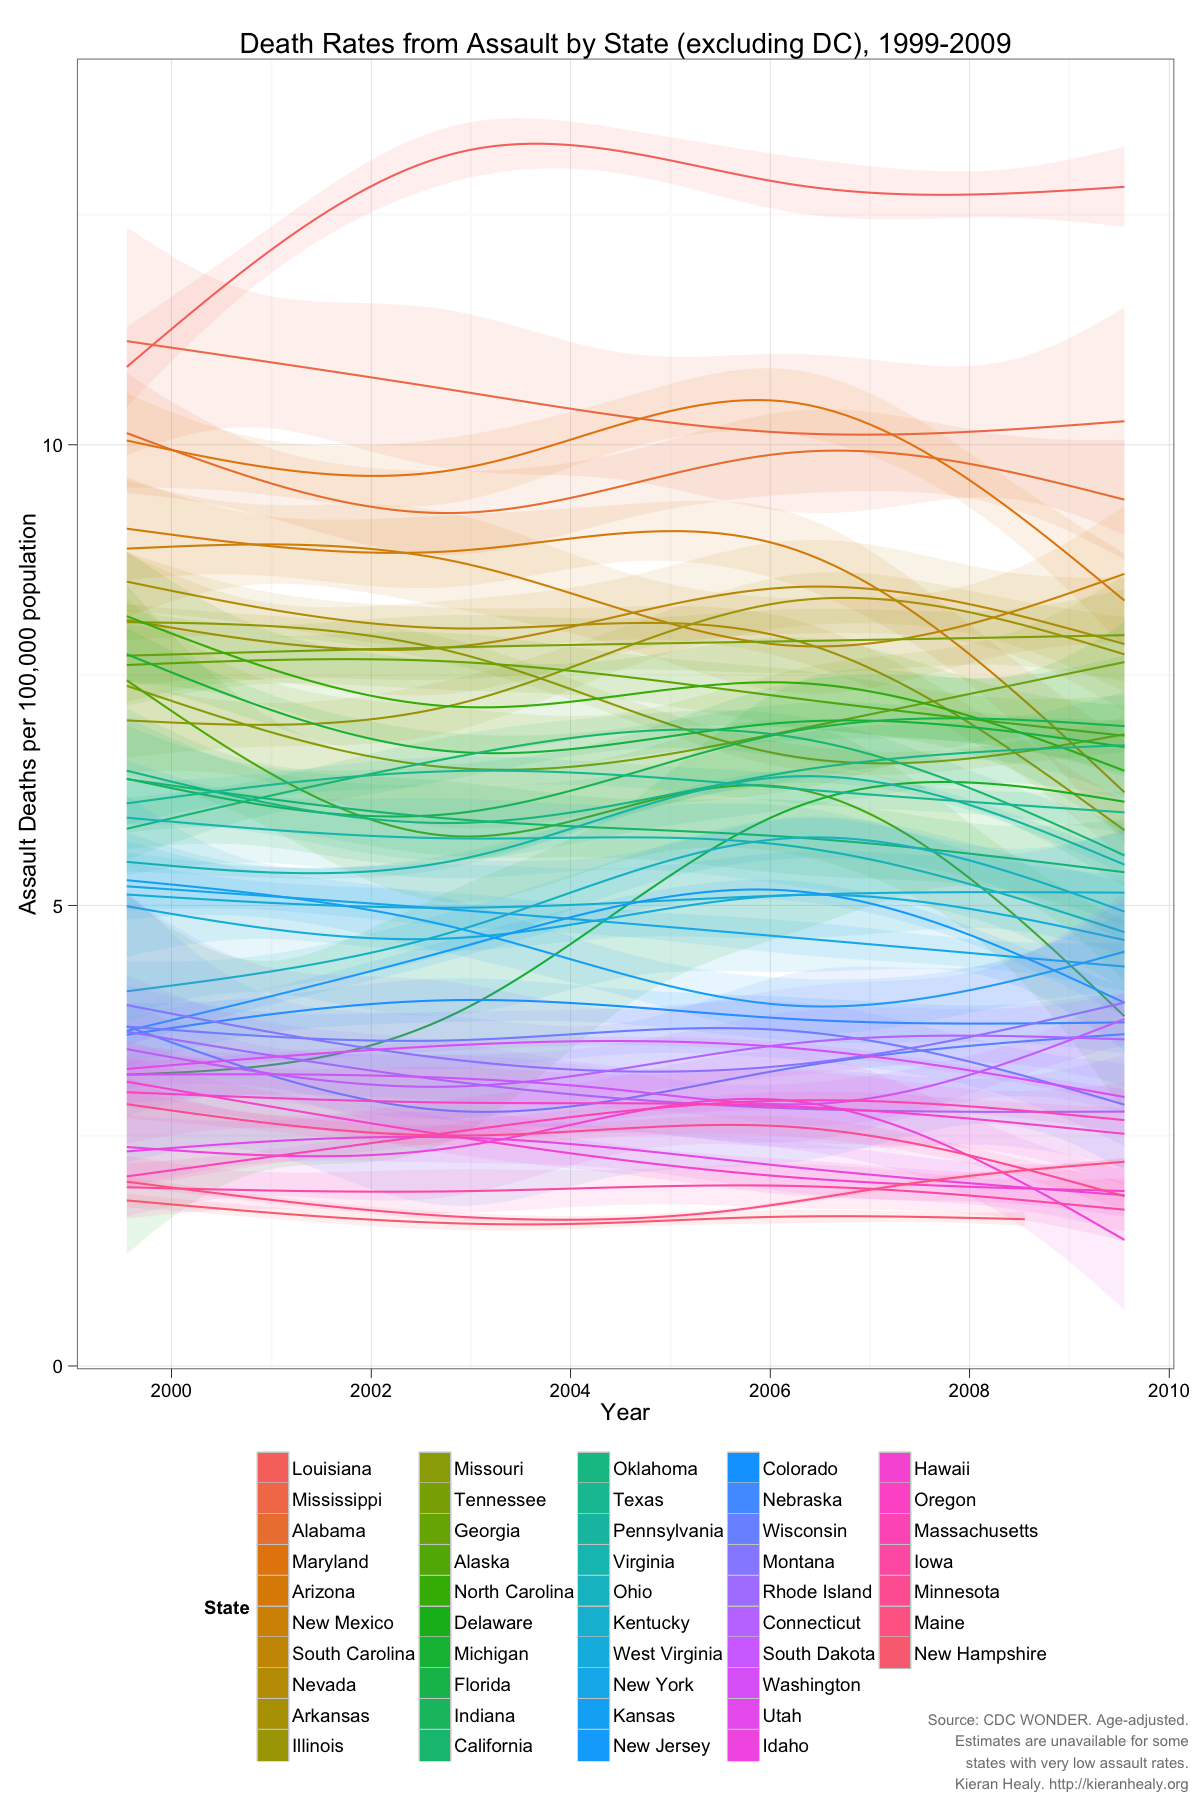
The chart in “America is a Violent Country” has been getting a lot of circulation. Time to follow up with some more data. As several commentators at CT noted, the death rate from assault in the U.S. is not uniform within the country. Unfortunately, state-level and county-level mortality data are not easily available for the time period covered by the previous post—though they do exist, going back to the 1940s. What I have to hand is a decade’s worth of US mortality data courtesy of CDC WONDER covering 1999 to 2009. I extracted the assault deaths according to the same criteria the OECD uses (for the time period in question, ICD-10 codes X85-Y09 and Y87.1). The estimates are adjusted to the 2000 U.S. population, which isn’t identical to the standard OECD adjustment. But the basic comparability should be OK, for our purposes.
First, it’s well-known that there are strong regional differences in the assault death rate in the U.S. by state and region. Here’s what the patterns look like by state from 1999 to 2009.

Trends in the Death Rate from Assault, 1999–2009, by State. Click for a larger PNG or PDF.
[click to continue…]