I came across a report yesterday, via Eric, about high rates of vaccination exemption in Sacramento schools. As you are surely aware, this is a serious political and public health problem at the moment. Like Eric, I was struck by just how high some of the rates were. So I went and got the data from the California Department of Public Health, just wanting to take a quick look at it. If you want to follow along, I put up a github repository with the data and R code for the plots.
I’ll just confine myself to a few descriptive plots about “PBEs” or Personal Belief Exemption rates amongst children in kindergarten across the state. I’ll say “children” for convenience in this post but I mean kindergarten-age children only, not all elementary-school kids. We have information from about 7,500 schools (of the 8,100 or so in the state). Because I’m just interested in exemption rates with respect to enrollments in the school, the number of usable observations is a bit smaller—just over 7,000 schools. In that population, across the whole state, just 3.36 percent of kindergarteners have a PBE. Note that although 96.6% of children don’t have a PBE that doesn’t mean they are all vaccinated. Most of them are, but for some the paperwork was missing at the time of reporting, or they don’t have all their vaccinations, or they have a medical exemption, and so on. The data contain those different measures but I don’t discuss them here.
One of the most interesting things about vaccination exemptions is how they cluster, and how much variability in vaccination rates changes as you look at more fine-grained resolutions. As a first cut, we can look just at public vs private schools. Right away a little gap opens up. From a base rate of 3.36% PBEs we find that only 2.84% of public school kindergarteners have PBEs, while 5.47% of private school kindergarteners do. There are far more kindergarteners in public than private schools (483,598 vs 38,342).
Next level of resolution down is the county. Here is a plot of PBE rates by county. We log the number of enrolled children on the x-axis to stop very high-population counties, notably L.A. County, from skewing the plot.
California Kindergarten PBE Rates by County, 2014-15. (PDF available.)
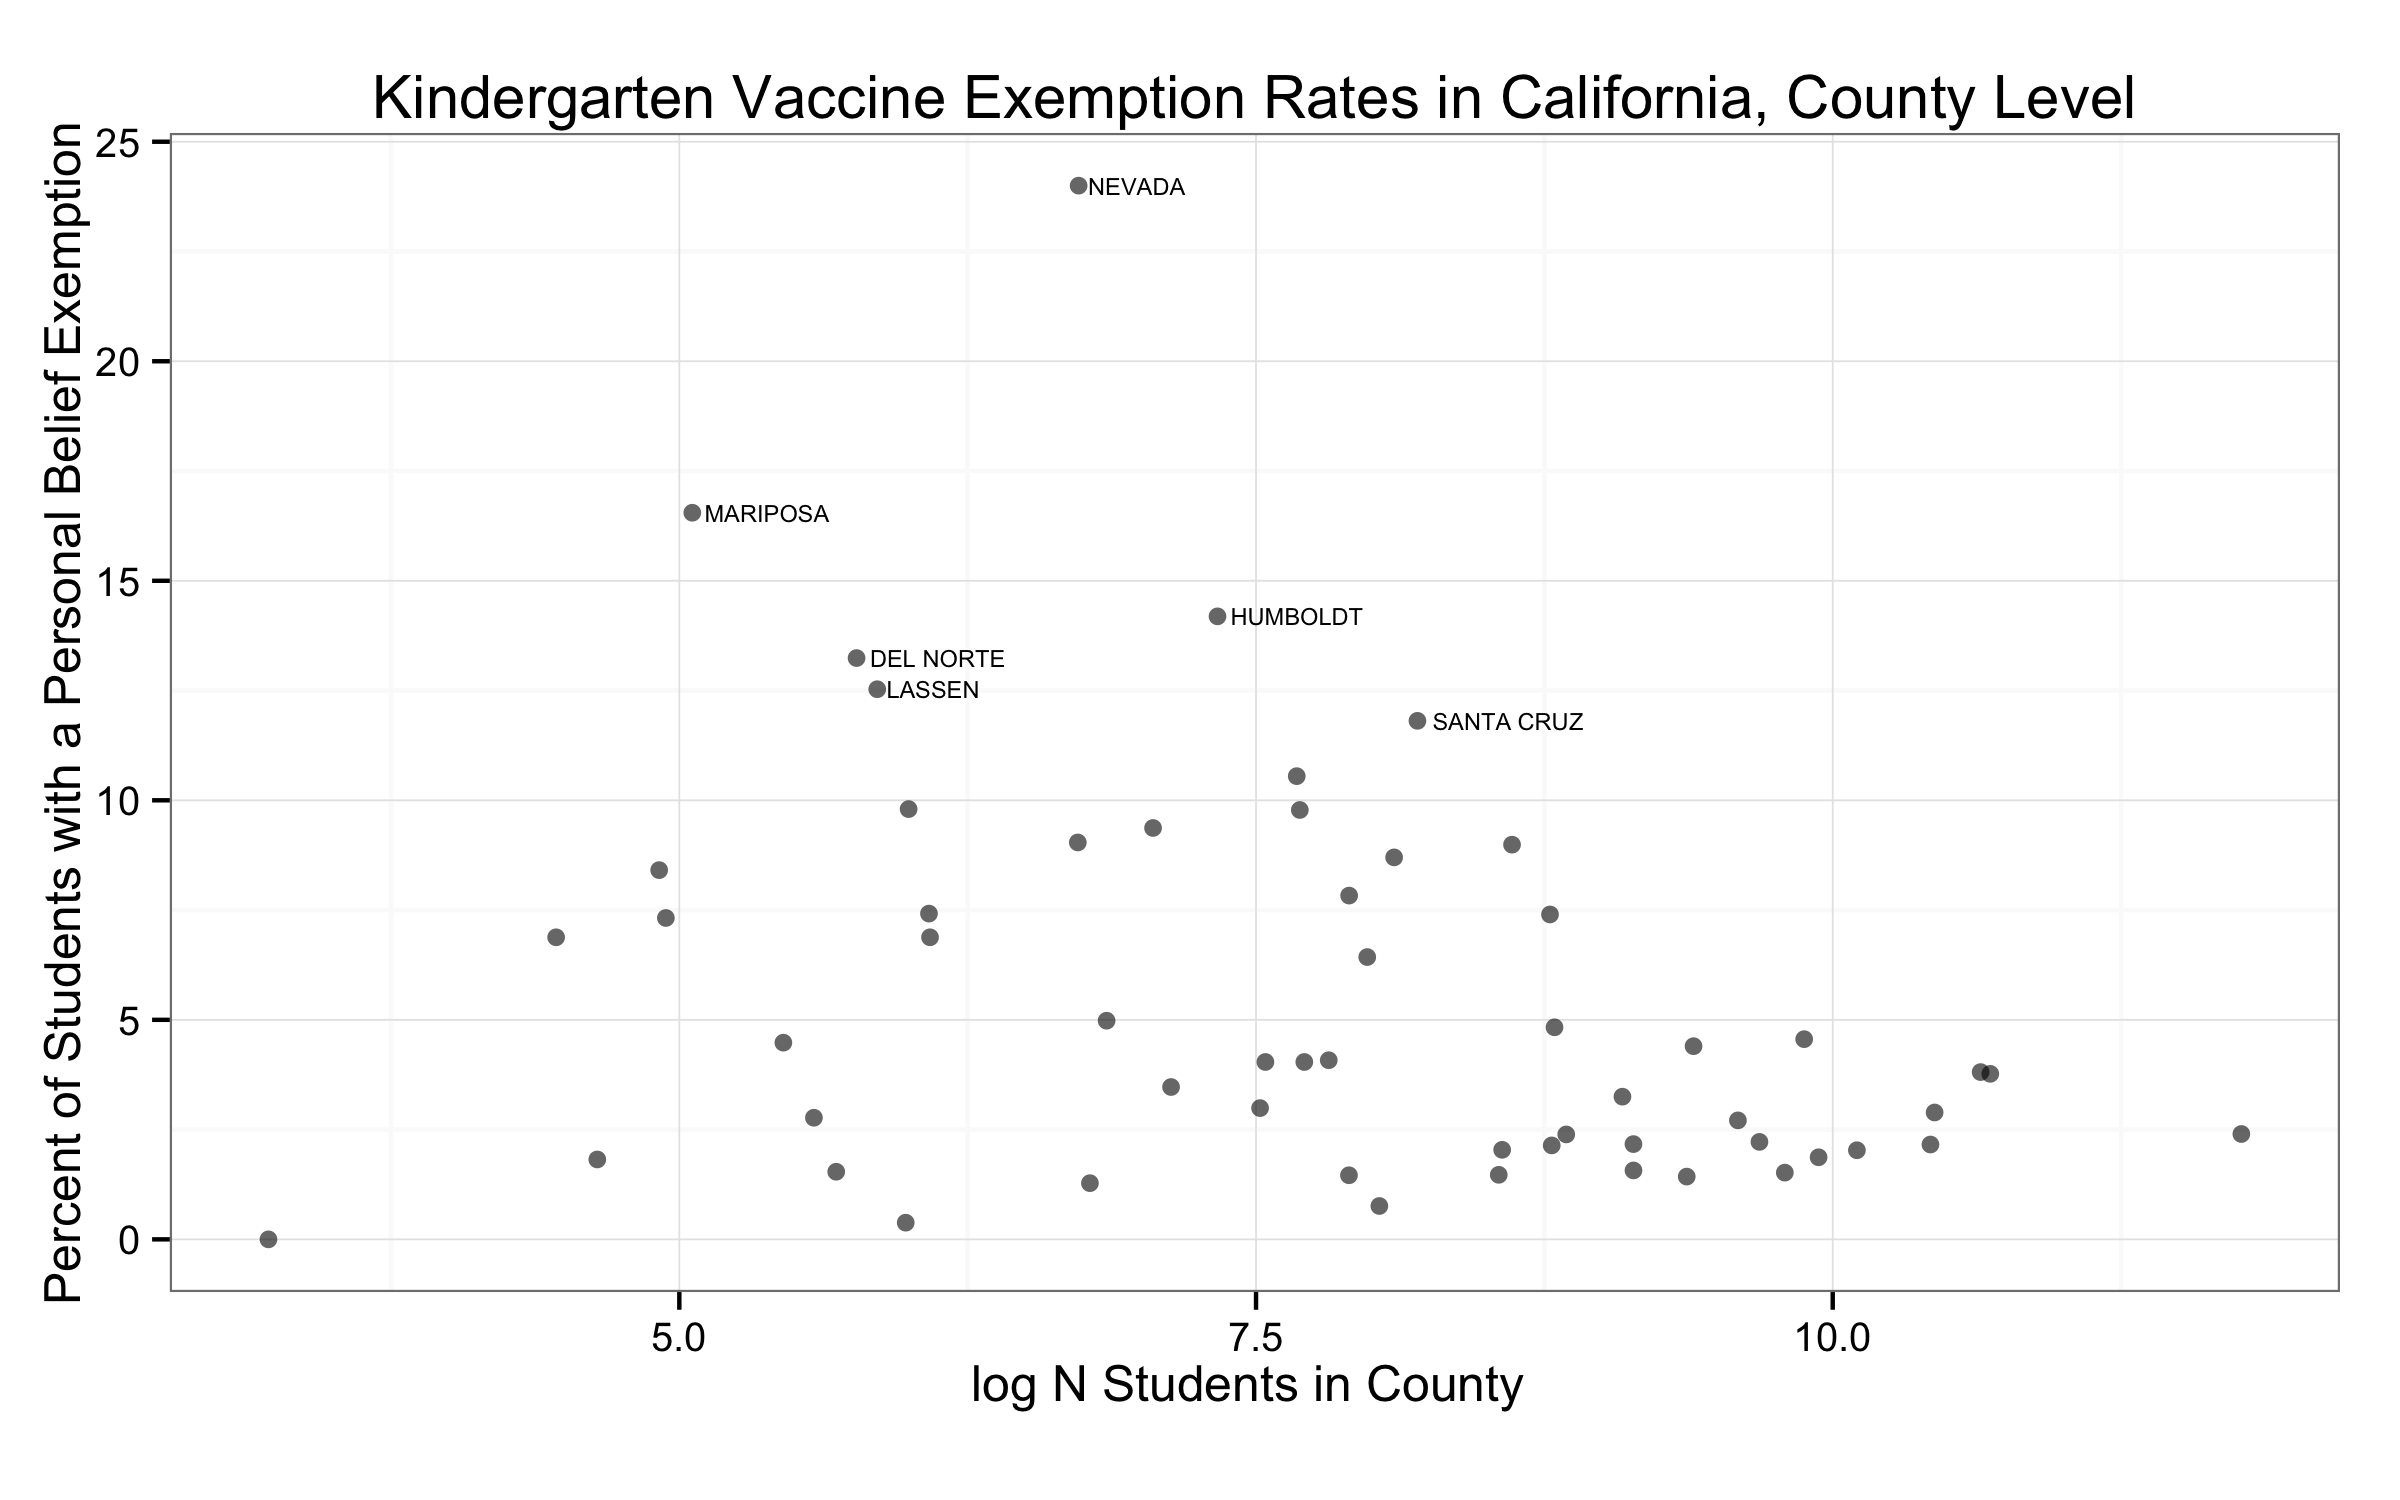
The figure picks out some outlying counties—those with more than twice the interquartile range for PBEs. With nearly sixty counties, we see there’s a fair amount of heterogeneity hiding in the state-level PBE rate. Our outlying counties have PBE rates of more than 10 percent.
The next twist of the lens is to look at the rates by district. In our population there are just over 820. Here’s what they look like.
California Kindergarten PBE Rates by Public School District, 2014-15. (PDF available.)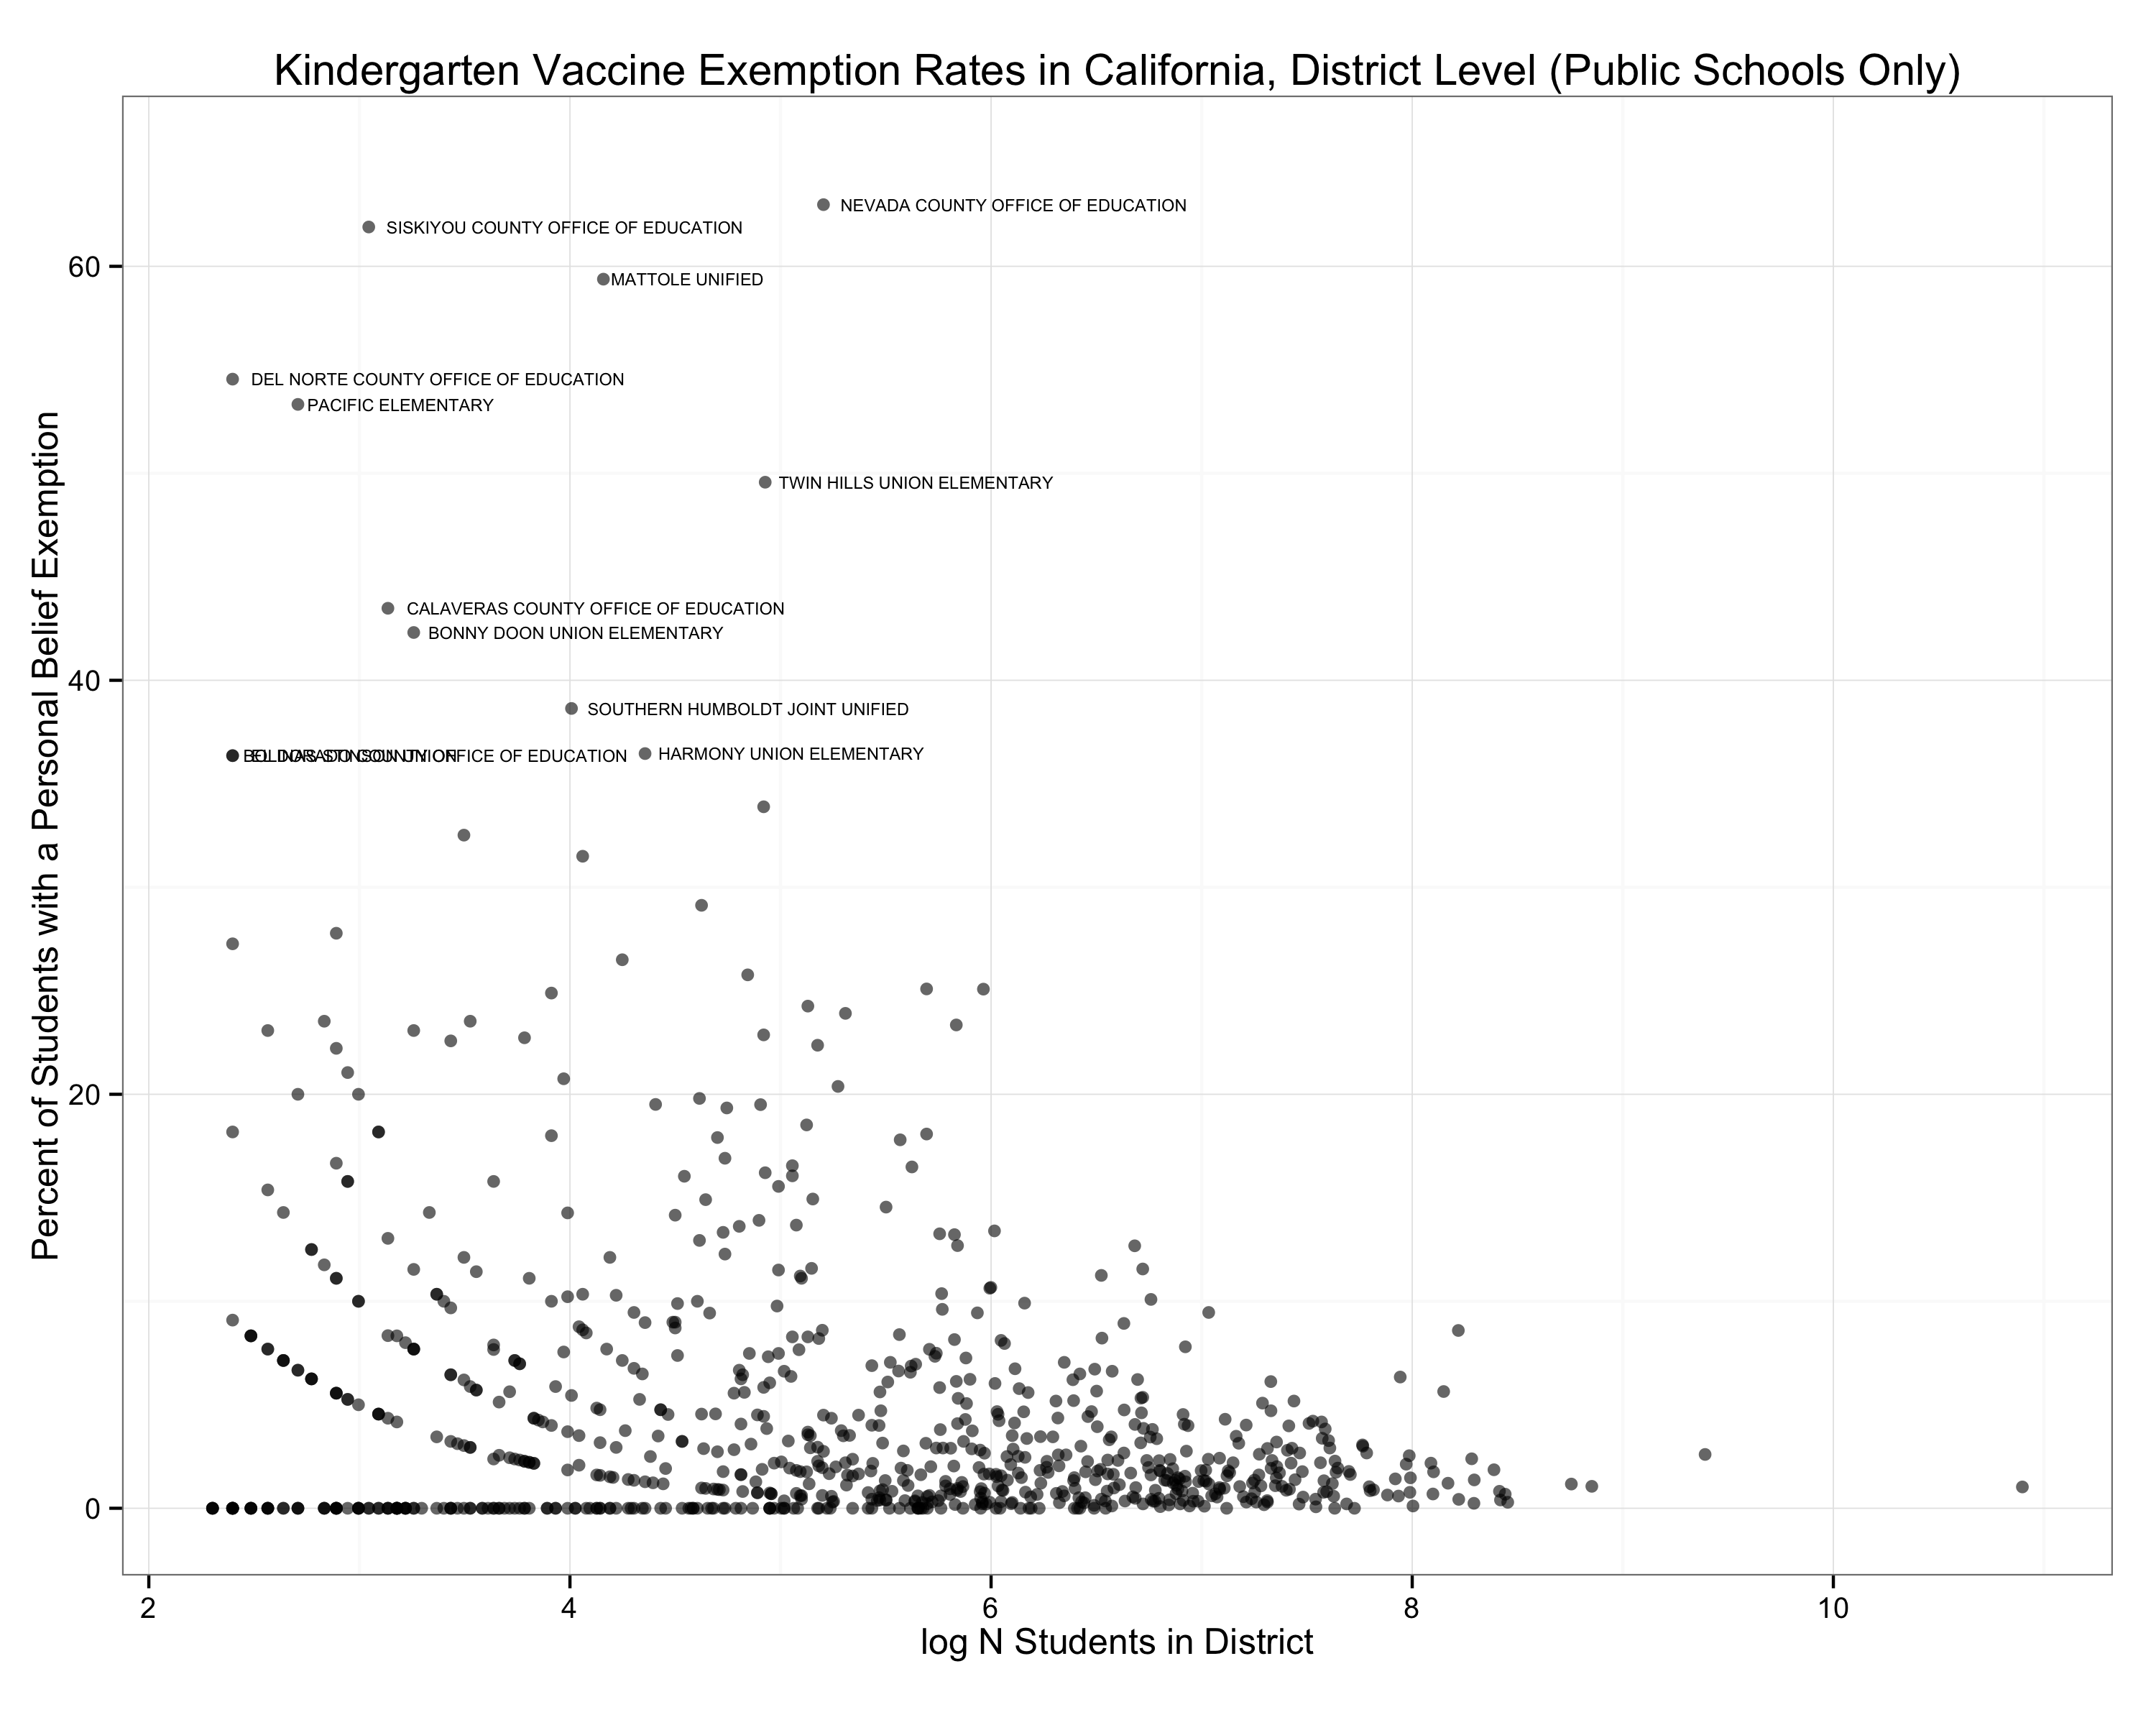
The x-axis covers more or less the same range (logged N students), but note that instead of topping out at 25 our y-axis now runs from zero to over sixty percent. A big jump. (And our criteria for getting a label goes from 2x the IQR to 6x.) Note that most of the high-rate districts enroll small numbers of students. Some of those districts have very few schools: the Siskiyou County Office of Education district has one Kindergarten group in the data, Golden Eagle Charter, with twenty one kindergarteners and a PBE rate of sixty two percent. Meanwhile the Nevada County district is more consistently an outlier. It has five schools in the data, enrolling 182 students in total with a PBE rate of 63 percent. Note that here, because we’re looking at public school districts, we are excluding private schools. Charter schools are included.
Finally here is the school-level distribution. Because we can look at all of them I’ve distinguished the public and private schools. The banding is an artifact of having the enrollment number in the calculation of both the x-axis (log Enrollment) and the y-axis (PBE students / Enrollment).
California Kindergarten PBE Rates by School, 2014-15. (PDF available.)
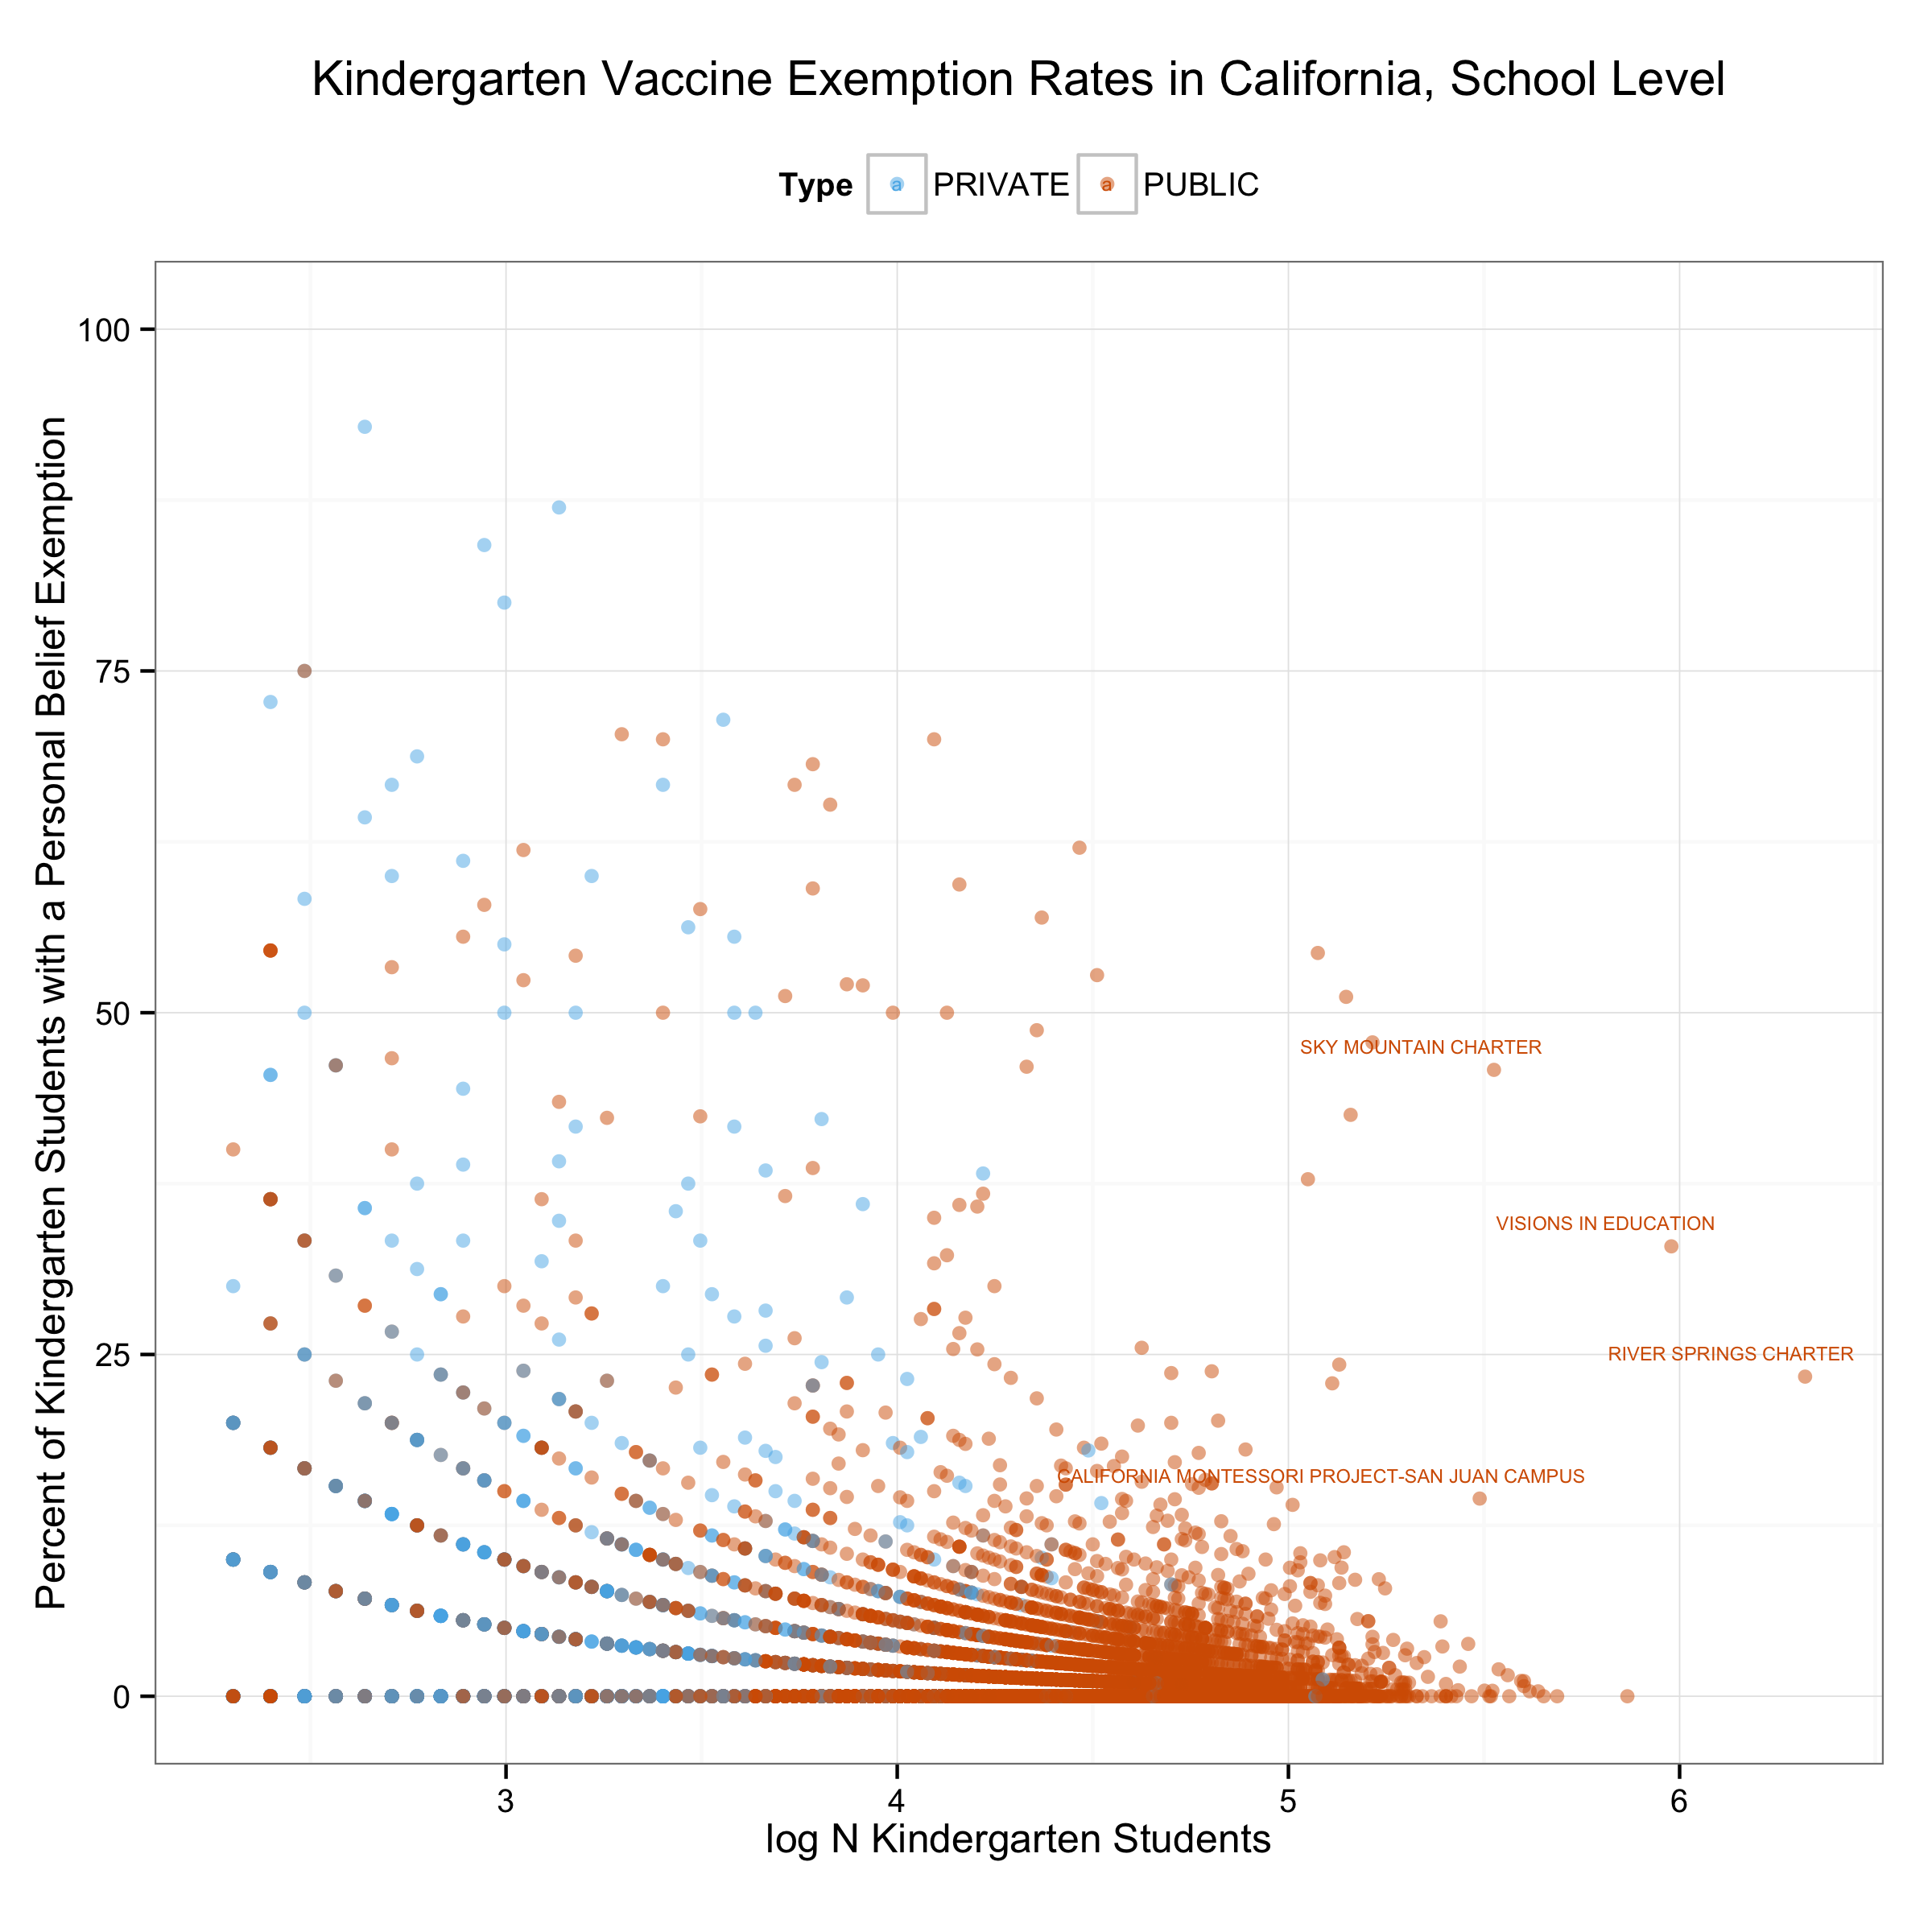
Now our y-axis has is pushed all the way to 100. The school with the highest PBE rate in the state is the Grace Family Christian School in Sacramento, with 93%. Next comes the Berkeley Rose School in Alameda County (87%), the Cedar Springs Waldorf in El Dorado (84%), Westside Waldorf in LA (80%) and the Kabbalah Children’s Academy in Los Angeles (75%, and yeah, I know). These are all relatively small schools and all are private. The median school enrolled seventy three kindergarteners (across several classrooms, of course). These five schools range from twelve to twenty three kindergarteners. Of the ten schools with the highest PBE rates, three are public. Two of those are in Nevada County, and the other is a public school in Sebastopol that enrolled twelve kindergarteners.
The concentration of PBEs in smaller schools is evident, as is the concentration in private schools. Note that regions with high PBE schools can still show a lot of heterogeneity. For example, consider schools in Berkeley. On the one hand it is home to the school with the second-highest PBE rate in the state. On the other hand, six of its fifteen other schools have PBEs of zero, two more are at three percent or lower, and the remainder range from six to sixteen percent PBEs. At the school level, the PBE rate for publics in Berkeley is 4.1% and for privates it is 18%. But there are far more children in the public schools, so at the student level the number of kindergarteners with PBEs, even in Berkeley, is not huge—about 67 kids out of 850 in the city. But 20 of those 67 are in the same school, and probably the same room.
Finally, the clustering also raises the question of whether there are big schools with a lot of PBEs. To bring this out a little more clearly here is the same figure as above but with the x-axis showing number of students rather than logged students.
California Kindergarten PBE Rates by School, 2014-15. (PDF available.)
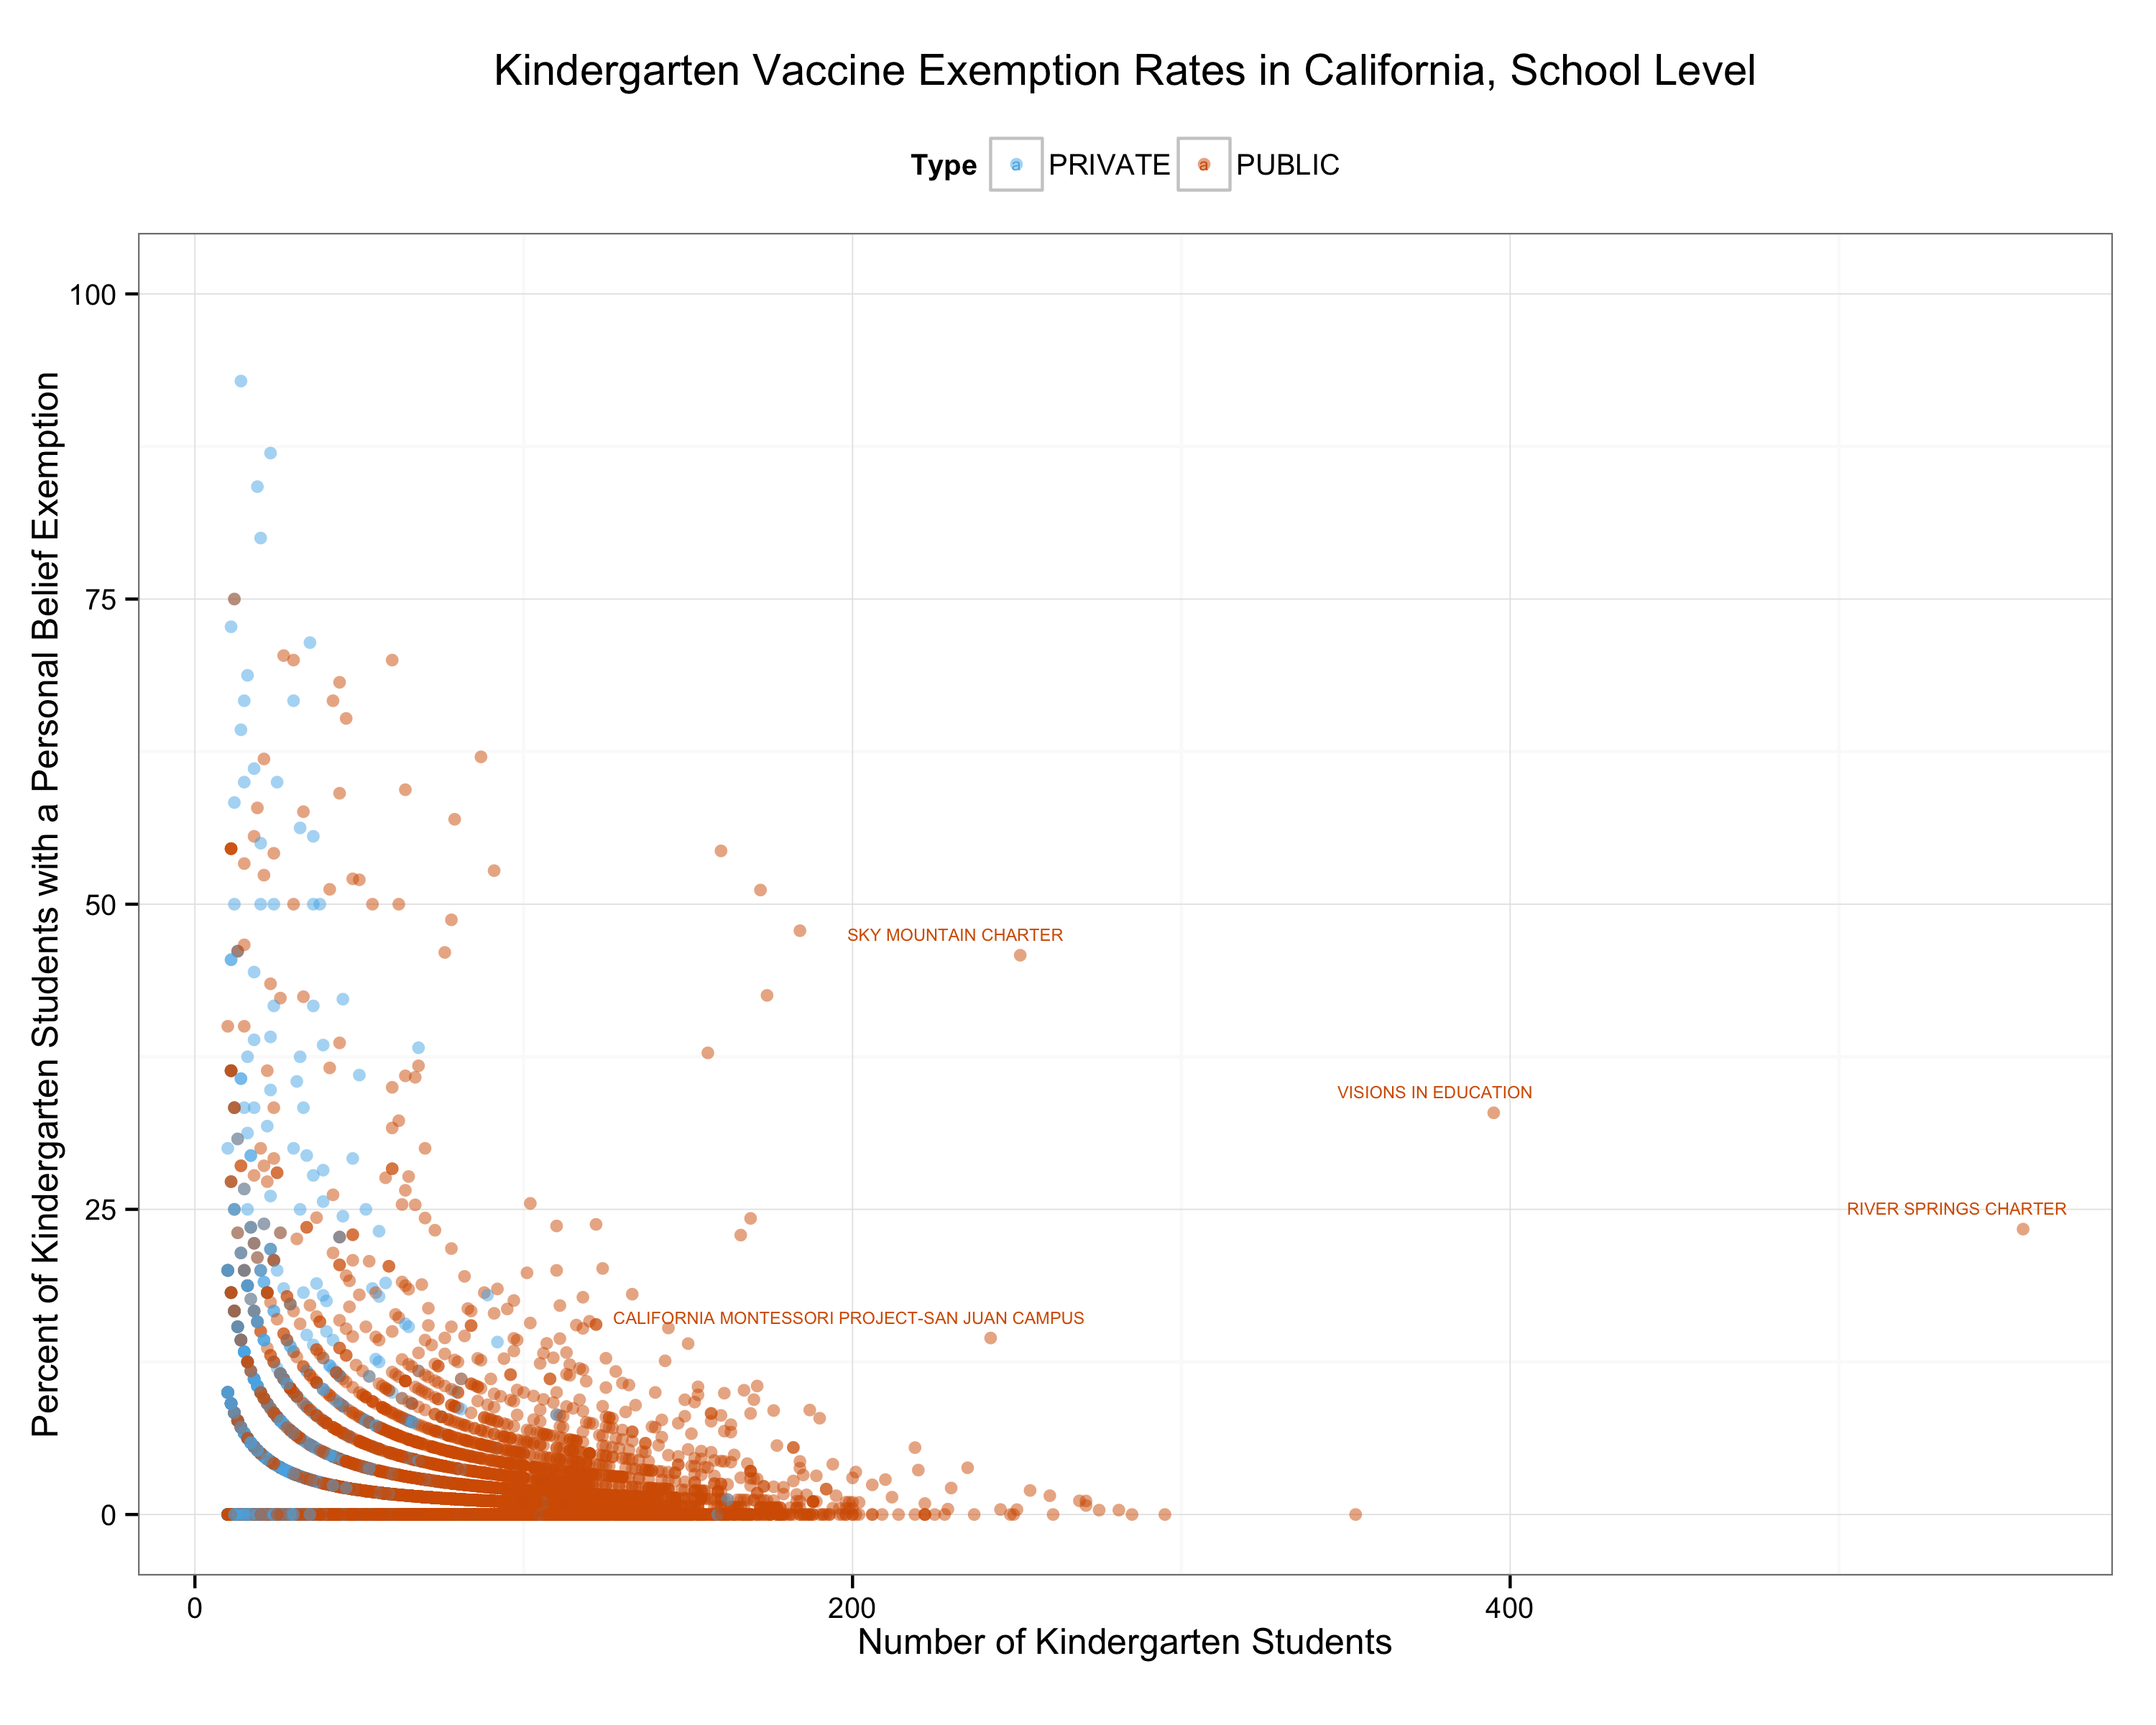
Here we see a couple of schools that are enrolling a very large number of kindergarteners and also have relatively high PBE rates. Four schools in the state reported enrolling more than two hundred kindergarteners while also having PBE rates of over 10 percent. River Springs Charter reported 556 students and a PBE of 23 percent. Honestly this makes me wonder if the person filling out the form reported the size of the entire elementary school rather than the size of the kindergarten classes. But then again American schools can get pretty huge, so the data are right that’s a lot of little tykes and a 23 percent PBE. Much the same goes for the California Montessori and Visions in Education schools, which reported 242 and 395 enrollments respectively, with 14 and 33 percent PBEs. This brings us full circle as both of these schools are in the same district—the San Juan Unified district in Sacramento. Perhaps someone familiar with these schools can tell me whether the denominators they’re reporting are correct.
{ 17 comments }
Mike Huben 01.30.15 at 12:47 pm
It looks as if quite a number of schools are well below the herd immunity threshhold for measles.
Vaccination is a classic Prisoner’s Dilemma problem, slightly complicated by being based on risk rather than direct payoffs.
Phil Koop 01.30.15 at 1:12 pm
What a great post. If only everyone would handle data so well. But you are fortunate to have such data to hand.
You might be interested in this related post by John Snyder at Science-Based Medicine: http://www.sciencebasedmedicine.org/hot-zone-schools-and-children-at-risk-shedding-light-on-outbreak-prone-schools. In summary, he notes that:
1) Vaccination rates are very heterogeneous at the school level.
2) So choice of school is a material concern to parents who want to protect their children from vaccine-preventable disease.
3) But such parents are alarmingly unusual, so that
4) There is not enough political pressure to make the necessary information available in many states.
One point he does not note is that this heterogeneity undermines the benefits of free-riding that were touted by at least one commenter to Eric’s post yesterday: although state-level immunization rates may look sufficient to provide herd immunity, vaccine-deniers tend to cluster their children. Wrong-way risk, we call that in the trade.
Adam Hammond 01.30.15 at 1:14 pm
Great data dump! thanks … kinda
I’ve been told my whole career, and before, about how scientists need to do outreach to the public. I do. I also continue to press the issue with my students, including making it a central part of my ‘ethical conduct of research’ course.
To what end? This just leaves me cold.
Map Maker 01.30.15 at 2:45 pm
River Springs Charter is a charter school that provides support to parents that home school. While they have some physical facilities, I imagine most of the kindergarten students are being educated at home.
As someone who works with data filled out by overworked administrators, I have sympathy for analyzing data with less-than-stellar completion details …
faustusnotes 01.30.15 at 3:21 pm
Nice graphs.
A brief google search suggests that the big schools with high student numbers are serving a huge community of home schoolers. Visions in Education, for example, lists 9 “locations” but advertises almost entirely as a home-school support service; while River Springs has a very vague website that suggests it has both physical locations and homeschool support services.
In mathematical models of diseases like measles, assortativity has a very important role. Assortativity is the extent to which groups mingle, and the magnitude of assortativity has a big effect on the spread of disease. In particular, experience with diseases like HIV suggests that if there is a small group of high-risk people, mostly interacting with each other but having occasional contacts with the outside world, a disease can persist even though the majority of people are taking all the necessary precautions. If you include assessment of spatial patterns in such analyses it gets even worse: there are probably areas of suburban or exurban anti-vax thinking that are basically acting as a protected pool of disease, that can continually reinfect otherwise disease-free areas with high vaccination rates. I hope some mathematical epi modellers get hold of this data and put it to use, because it could provide fascinating insights into just how dangerous anti-vax homeschoolers can be.
Doctor Science 01.30.15 at 3:50 pm
What the *heck* is going on in Nevada County?!? Is it really just crunchy-granola gone wild, or is there a religious-conservative element, too?
marcel proust 01.30.15 at 3:51 pm
This link may be of interest:
http://www.unz.com/gnxp/where-californians-are-not-immunized
Sargon 01.30.15 at 5:00 pm
According to this accreditation report from 2013, the number for River Springs is most likely accurate:
http://old.springscharterschools.org/images/pdf/About_RSCS/2013_wasc_report.pdf
That said, as the other commenters pointed out, it seems to be some sort of homeschool-support-type-thing, and there are multiple locations, so maybe it’s more accurate to compare it to a school district rather than a single school? Somewhere in the report there’s a table that does just that…
Ogden Wernstrom 01.30.15 at 9:40 pm
The only enrollment number I found for River Springs Charter (in a short search) is 5,000. As others have mentioned, River Springs is a resource for home-schoolers. (Since charter schools in the US usually get tax funded at a per-student rate, I suspect this generates a lot of cash from the government.)
Michelle F 01.30.15 at 9:46 pm
Interesting. Perhaps non-vaxxers should have their own school system? Just an idea.
Dave W. 01.31.15 at 12:12 am
I was confused by the comment “The banding is an artifact of having the enrollment number in the calculation of both the x-axis (log Enrollment) and the y-axis (PBE students / Enrollment),” until I realized that you must be using natural logs (which I usually see represented as ln n), and the banding occurs when the Enrollment size is so small that each additional student with a PBE causes a noticeable jump in the percentage. So for ln n = 3 (which would have n around 20), the percentage will be 0%, 5%, 10% … Each band represents a jump of one more student with a PBE.
Thus a point at (3, 20) represents a class with 20 students, 4 of whom have PBEs. That’s not great, but it could just be a one-year statistical blip from a handful of non-vax families that all had kids in kindergarten the same year. It doesn’t quite represent the same threat of massive spread that the graph initially suggested to me (although those kids probably also have unvaccinated brothers and sisters). The more important parts of the graph are to the right of the noticeable banding, where the rates are presumably more stable year-to-year.
Magari 01.31.15 at 9:02 am
Nevada County is a strange mix of leftover loggers and miners, in-migrants from the Bay Area and Sacramento (complete with their hippy ideas), and exurbanites for whom more immediate exurbs of Sacramento are too close to “people.” So I suspect the lack of vaccinations is a cross between hippy and libertarian.
bad Jim 01.31.15 at 9:20 am
Laguna Beach, my home, showed up as having 15% unvaccinated kindergartners, but according to the local news the rate has dropped recently. Perhaps it’s no longer considered quite as respectable.
Fear’s an odd thing. I live near one of our two elementary schools, at the top of a very high hill, such that walking is only an option for those in the immediate neighborhood, and it seems that half the parents prefer to drive their kids rather than entrusting them to the bus. It’s probably much less than that, but enough to be a reminder that many parents have an oddly skewed perception of risk.
Kieran 01.31.15 at 1:12 pm
Dave W—yeah, sorry for the confusion; too many years using R, where by default log() = natural logs and log10() is base 10.
Main Street Muse 01.31.15 at 1:29 pm
When we talk about anti-vaxxers – are these people who are opting out of SOME vaccines – or are they refusing ALL vaccines for their children? I confess that I cannot figure out the rationals they use to reject all vaccines and leave their children vulnerable to polio, diphtheria, whooping cough, tetanus, etc.
Seems the data indicates many anti-vaxxers home school? These are families that exhibit a massive distrust of teachers, doctors, vaccines, etc. I guess God will shower them with grace and measles.
James Wimberley 01.31.15 at 3:47 pm
A great link from Daily Kos:
Finally, an easy to read webpage for the layperson explaining how vaccines cause autism.
Main Street Muse 02.03.15 at 2:53 am
For those so inclined, here’s a fascinating history of the debate over mercury, vaccines and autism… http://1.usa.gov/1uSqgtr
Comments on this entry are closed.