A really interesting chart, via Tom Forth on that Twitter. It plots inequality in the UK against the income of the poorest 10%, as a time series.
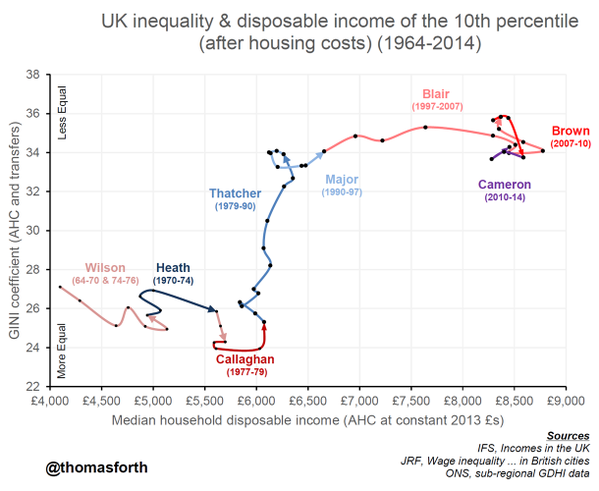
This is a perfect application of interocular trauma econometrics – it hits you right between the eyes. It’s all up-and-down or left-and-right. The sort of thing that generates the difficult cases for liberal political philosophy – increases in inequality which nevertheless benefited the worst-off, which would have showed up as a southwest-to-northeast upward slope – never happened.
{ 132 comments }
Daniel 08.12.15 at 2:35 am
I suppose one could argue that the overall, 1964-2014 slope is exactly the Rawlsian up-and-right profile, and from thence that the Thatcher era increase in inequality was necessary to set the stage for the gains for the Blair years. But that would seem desperately unconvincing to me.
Matthias Gralle 08.12.15 at 2:41 am
Is the legend (and the post) consistent with the horizontal axis? It seems the horizontal axis depicts the median, that is the 50th and not the 10th percentile.
Bobrovski 08.12.15 at 2:43 am
The x axis is mislabeled but the chart title is correct.
Adam Hammond 08.12.15 at 2:45 am
Fascinating.
It isn’t precisely up and down, is it? There aren’t many downward steps, and those few are all accompanied by a rightward shift.
Daniel 08.12.15 at 2:53 am
#2: it is the 10th percentile. The guy tweeting it had previously done the same chart with the median, and didn’t change the legends.
Vance Maverick 08.12.15 at 3:08 am
Well, they never happened in sync. If I were determined to tell a trickle down story, I would only need to add a delay or anticipation to the causal linkage.
Daniel 08.12.15 at 3:14 am
Yes, that’s what I mean – Thatcher increased inequality between 1979 and 1989, then nothing very much happened for eight years, and then all of a sudden lowest decile incomes started to take off, for reasons that had nothing to do with the policies of the day, but were just a delayed reaction! Pretty unconvincing when you say it out loud to be honest.
Vance Maverick 08.12.15 at 3:19 am
All the model needs is an epicycle!
js. 08.12.15 at 3:21 am
I guess you could kind of make a case for ’95-’00-ish, at least if I’m reading this right. But again, it’s a little desperate. I’m almost as surprised that even in the median income chart, there’s basically zero instances of a northeast-to-southwest slope. Reducing inequality is not counterproductive, shockingly!
Mostly though: this is great! Thanks.
Mark Watson 08.12.15 at 3:40 am
On the basis of the data presented in this chart one conclusion is clear: Thatcher really did significantly change the UK; perhaps forever.
Now I understand the cover of The Economist 13th April 2013.
And I quote: “Now especially, the world needs to hold fast to Margaret Thatcher’s principles”. Really?
speranza 08.12.15 at 3:59 am
I realize now I’m slightly unclear on what exactly the mechanism would be by which Rawlsian inequality is thought to benefit the worst off — are the incomes of the worst off simply supposed to increase via some sort of trickle-down effect, or can incomes at the bottom remain stagnant but the bottom earners still benefit via a welfare state that’s newly flush with tax revenues paid by the high earners? Not that I’d try to claim that the second option is any kind of description of the Thatcher years, but could you tell a (hypothetical) Rawlsian story where inequality makes it possible for the state to improve the condition of the worst off in a way that doesn’t show up in disposable income?
speranza 08.12.15 at 4:35 am
Never mind, I seem to recall now that Rawlsian inequality has to be a post-tax, post-welfare inequality, since taxation/redistribution is the only way of affecting inequality that’s properly part of the basic structure of society. Anyway, this is great work, a really impressive demonstration.
Sebastian H 08.12.15 at 7:22 am
I don’t know enough about British politics to be able to guess. What was happening in the Blair years? Massive increase in transfers? Rising economy raised all boats? Massive employment program? Just lucky to be in the post Soviet collapse boom but not catch much of the crash?
Stephen 08.12.15 at 8:14 am
Veryinteresting, many thanks.
It gets even more interesting if you follow the link to Tom Forth’s site, where he has a similar graph plotting GINI coefficient against household income after housing costs. Here, there is a very strong, consistent and prolonged southwest-to-northeast trickle-down trend under Thatcher, after a wobbly first couple of years: exactly the effect which, in the first graph, never happened. A really difficult case for liberal political philosophy?
Two minor points. The start of the great rise in GINI began under Callaghan, before Thatcher: of course that may have been a random fluctuation, not an effect of a coherent economic policy (my memory of the Callaghan years holds few traces of anything coherent). And the highest point of inequality seems to have occurred in the reign of Good King Gordon.
Metatone 08.12.15 at 8:43 am
@SebastianH
Off-hand it’s a combination of all those factors. One of the crucial ones is that when the economy does get to a real growth spurt then many people get into employment who would not otherwise. (Seen also in the Clinton era in the USA) This was buttressed with tax credit policies and the like, which definitely represent an increase in transfers – although I don’t have the figures at hand to say “massive.” As for what made that growth spurt? The evidence says a lot of it was about growth in local and international finance, generally good times in the world economy etc. Productivity and trade balance both stayed on (disappointing) trend… A mix of luck and judgement one suspects, with a dash of not addressing many of the longer term issues…
Metatone 08.12.15 at 8:45 am
@Stephen – but why should housing costs be excluded – they are core to life.
Indeed surely this is a clue to how the arrangement of the economy has and is changing. GINI increases are at least partly buttressed by the arrangement of the retail banking and the housing markets.
Stephen 08.12.15 at 8:58 am
Metatone: housing costs are of course essential, but the second graph I mentioned was looking at disposable income. If my housing costs go up, then all other things being equal my disposable income goes down, and vice versa.
I would like to think that Daniel didn’t mention the second graph, showing what looks like a strong trickle-down effect under Thatcher, because he didn’t know about it.
Timothy Scriven 08.12.15 at 9:28 am
As a long-term subscriber to the view that the two major parties are largely the same on these issues – Blair most of all – I must admit I find myself surprised and epistemically humbled.
Stephen 08.12.15 at 10:33 am
Apologies: shouldn’t post too early in the morning. Daniel’s graph is of course for GINI versus disposable income of 10th percentile (should that perhaps be lowest decile, why choose 10th percentile, what about the first to ninth?) and does indeed provide little obvious evidence for the trickle-down effect. That’s all right, then.
The other graph I referred to shows, I think, GINI versus median disposable income, and shows that Thatcher’s policies fairly consistently increased both.
Metatone 08.12.15 at 10:45 am
@Stephen – notable comparing the Thatcher with Blair era for median disposable income (i.e. not the graph on CT) that they both seemed to have a similar income growth rate, but rather different GINI growth rate…
Barry 08.12.15 at 10:45 am
Metatone 08.12.15 at 8:43 am
“Off-hand it’s a combination of all those factors. One of the crucial ones is that when the economy does get to a real growth spurt then many people get into employment who would not otherwise. (Seen also in the Clinton era in the USA)”
This is huge. Note that the elites define ‘inflation’ as ‘rising wages for the 90%’; nothing else seems to matter.
Trader Joe 08.12.15 at 11:35 am
I’m not expert on GINI co-efficients, but is the scaling skewing the graph a bit?
I look at the critical Thatcher/Major era and the GINI coefficient rises 36% while income rises abotu 10%, that would imply a 3.5:1 ratio not the near verticle slope that the chart implies.
Looking over the full scale of the graph GINI rose from about 26 to 34 or 31% while incomes approximately doubled, surely there is some inflation effect, but that ratio doesn’t seem nearly as drastic as the chart seems to imply.
Maybe there’s something about GINI that makes the scaling correct, but the two scales are certainly not proportional to one another – which is what would be necessary for the SW to NE slope Daniel is looking for.
Peter T 08.12.15 at 11:38 am
Would the fall in housing costs for the lowest decile in the Thatcher years have something to do with the ability to purchase council housing on easy terms?
Ed 08.12.15 at 1:48 pm
“The sort of thing that generates the difficult cases for liberal political philosophy – increases in inequality which nevertheless benefited the worst-off, which would have showed up as a southwest-to-northeast upward slope – never happened.”
The chart doesn’t quite show this. As some of the other commentators have noticed, during the Blair government there was a small increase in GINI (about 1.5%) it appears, but the income of the least well off increased fairly substantially.
I was also surprised that the chart showed a real difference in the records of the two big parties, or more specifically between that of Thatcher and Blair, which combined account for half (21 out of 46) of the years covered. Most of the increase in inequality occurs under Thatcher, going from roughly 25 to 34, while the incomes of the poorest stay flat. Under Blair, as I stated, inequality goes up a little and the incomes of the poorest go up fairly substantially. I had the impression that Thatcher increased welfare spending and that inequality went up much more substantially in the Blair years. I’ve had to revise my opinion of Blair up and of Thatcher down.
For the other half dozen PMs covering the other half of the period, the chart confirms my previously held opinion that the Labour governments of the 60s and 70s are seriously underrated, the chart in those years slopes down and to the right. Under Major, Brown, Cameron, and to some extent Heath it does these loop-de-loops and at first glance I’m not sure what to make of that.
Plume 08.12.15 at 2:17 pm
Of course, even the old social democratic idea of redistribution has been trounced in the era/error of neoliberalism . . . . but it was never the right way to fix inequality. It’s the proverbial “closing the barn door after the horses have gotten out.”
The most effective way of fixing inequality isn’t to try to re-jigger things after the fact. It’s to guarantee living wages and as flat an income hierarchy as possible before the paychecks are even written. Pay as close to equal wages as possible, and there’s no need for the “redistribution” later.
As the young kids used to say, “duh.”
Orwell thought a 10 to 1 ratio — ownership to rank and file — fair. I think 4 to 1 is much better. And it’s pretty much already the general ratio in the public sector. Make it the ratio for the entire economy, and you’ll radically reduce inequality over time. Throw in free access to public education from cradle to grave; universal healthcare; high speed public and other forms of transit . . . . and we further reduce disparities.
And by free, I mean free. If you go to a public school, pre-K all the way through post-Doc, it’s literally free. This we can do even under the failed system of capitalism, though replacing it would be far better — from a moral, ethical, logical and humane POV. But we can make the above changes even under its reactionary, repressive, oppressive regime. All it takes is the will to finally implement actual democracy in the world — for the first time in its history.
Watson Ladd 08.12.15 at 2:19 pm
Metatone, I think one can think of this as a two regime period. The choice of regime affected Gini coefficient by changing it, but growth under both regimes benefited the worst off. Thatcher changed regimes, and later prime ministers continued that regime of policy.
The question is whether the welfare state could continue. Much of the economic regulation of the Fordist era was just stupid: see the ICC for details. States like Japan that continued the Fordist regime have not done particularly well. At the same time the much vaunted Nordic model has meant very little regulation, and much more tax transfers.
Barry, you can look up how the CPI is calculated. Hint: it’s not via real wage growth of the 90%.
Barry 08.12.15 at 2:29 pm
“Barry, you can look up how the CPI is calculated. Hint: it’s not via real wage growth of the 90%.”
Read any MSM discussion of the effects of increasing wages (not counting the top), and see if the attitude is pro or con.
Plume 08.12.15 at 2:36 pm
The only time in the history of capitalism that “growth benefited the worst off” was during its one and only middle class boom. Roughly 1947-1973 in America, and pretty close to those dates in Europe.
It’s the only time in the history of our current economic system when the middle class and the poor actually gained ground on the rich. Before and after, it has lost ground.
And, of course, that’s saying a ton. Because when the top percentiles are already so incredibly ahead of everyone else, you need protracted periods of massive gains (for the middle and lower) to make a significant difference. They were solid during the one and only middle class boomlet, but not spectacular . . . and they were also primarily limited to white males, with exceptions here and there.
It has never, ever been the case — and it can’t be, logically, mathematically — that the top can “grow” without it radically increasing the gap between them and everyone else. They have too much of the total income and wealth for that to happen. The myth we tell ourselves, the one lodged inside all too many heads, is that people can get filthy rich and it doesn’t affect anyone else. Sorry, it does. It always has. Not only in that they can’t get richer in the first place without subtracting income and wealth from those below them; they can’t get richer without putting far more distance between themselves and everyone else. It’s simply magical thinking to suppose everyone can benefit from the growth in riches at the top.
How convenient that the people peddling this alchemy are the rich and their shills.
Zamfir 08.12.15 at 3:03 pm
@Plume, the graph says that growth benefited also worked to the advantage of the poor in the years around 2000? About as much as before 1973
Plume 08.12.15 at 3:13 pm
Zamfir,
I’m not seeing that. The distance between the top and everyone else still increased and was already grand canyonesque. And, again, given the already massive gap, even staying the same is an actual loss. The gap itself weakens the poor and the middle, reduces its net over time, increases its cost of living, especially for big ticket items — education and health care, especially. Asset growth at the top means all of that. A reduction in net worth for everyone else.
You can’t have that without seriously harming everyone else, and it comes from everyone in the first place. The only way for the top to add, is for them to subtract from others.
Zamfir 08.12.15 at 3:22 pm
Plume, I am not sure what you mean. The graph says that inflation-adjusted income at the 10th percentile rose from 6500 to 8500 in about 10 years – that sounds to me like growth was benefiting people who are badly off, economically. While the gini coefficient stayed fairly flat.
Isn’t that exactly what you were looking for? Growth for poor people, without the rich pulling away?
Plume 08.12.15 at 3:25 pm
Also, is there any kind of graph to go along with this one . . . . that would show buying power changes? While the break down of median income is very important information . . . it’s far more useful to note the changes in what the poor and the middle can actually purchase with that median income, especially regarding things they need, and things that give them a chance to live a decent life.
Health care, education, housing, transport, etc.
All too often, the Heritage Foundation retort is to point to the number of household gadgets people now have, without, of course, detailing if they’re used, purchased on Ebay, etc. etc. . . . rented and the like. And then to make this some kind of “proof” that trickle down “works.” Rather than to note the increasing loss of access to the really important things individuals and families need to make a go of it.
Cut through the BS and it’s pretty clear that things are getting worse for the vast majority, and they must, when the top does better. There is no way around this, at least without alchemy.
Plume 08.12.15 at 3:27 pm
Zamfir,
But where is the side by side comparison? I’m probably misreading the graph. But where is the direct comparison between the top and the middle, the top and the poor, the middle and the poor, etc.?
Everyone’s relative increase or decrease?
Metatone 08.12.15 at 3:48 pm
@Watson Ladd – Krugman posted a good graph on GDP/capita growth recently. When you subtract the demographic issue, Japan has basically done as well as anywhere…
Plume 08.12.15 at 3:53 pm
Metatone,
Do you have a link for that?
PK, btw, was a bit late to the inequality issue. And he’s still not even to the mainstream liberal position of a Stiglitz or a Reich. He’s much better than conservatives, who want to claim that it either doesn’t matter or doesn’t exist. But he’s not as good as he should be.
Nick 08.12.15 at 6:22 pm
This is a fantastic graph. But I think its important to look at the margin, not just the average, when you are looking at household data – household formation and destruction. New households in the last few years have been suppressed due to high house prices. Its possible that people just have to be richer under Blair to form a new household. If they don’t form a new household, they don’t turn up the in statistics in the same way. I can’t find good data on household under Thatcher to see if that could have had an impact on the average there.
Layman 08.12.15 at 6:40 pm
Plume @ 34
Here’s a link to the Krugman piece re: Japan & per capita GDP.
http://krugman.blogs.nytimes.com/2015/08/11/competitiveness-and-class-warfare/?module=BlogPost-Title&version=Blog%20Main&contentCollection=Opinion&action=Click&pgtype=Blogs®ion=Body
Ronan(rf) 08.12.15 at 6:56 pm
“Off-hand it’s a combination of all those factors…..”
What about the introduction of the minimum wage in 98 ?
Zamfir 08.12.15 at 7:08 pm
Plume says: But where is the side by side comparison?
—-
That’s what the Gini coefficient indicates, as far as one can catch such complications in a single number.
LFC 08.12.15 at 8:02 pm
Ed @23
Under Blair, … inequality goes up a little and the incomes of the poorest go up fairly substantially.
Yes, that’s what the graph shows (bracketing the household data issue Nick raises @35).
I’m guessing the household incomes of all deciles in the UK went up in the 1997-2007 period. If that guess is correct, economic growth in that decade benefited all income groups, with the better-off benefiting slightly but not much more proportionately (b.c inequality rose only slightly).
What implications does this have? It shows that under certain conditions, caused by a combination of various factors already discussed by commenters above, the benefits of economic growth can be distributed reasonably (not perfectly) equitably. But we already knew that that is *possible* under certain favorable (policy + luck/whatever) conditions. So offhand I’m doubtful that any grand, startling inferences can be drawn from this.
s0meguy88 08.12.15 at 8:15 pm
Does that graph make sense? I am completely unsure. It might over state or under state or get it right.
Real income generally increases over time whatever the level of inequality.
Does the Gini really make sense as the Y axis?
A large portion has a vaguely NE orientation. Difficult cases?
Does a line graph make sense?
Take the average growth rate. Any year with growth above that where the Gini increases is a difficult case. Any year with growth below that where Gini decreases is also a difficult case. And the opposites are the easy cases.
What about percent over the average growth vs percent Gini change? I am pretty sure you cannot do that.
I am just uncertain the graph is really telling us what we want to know regarding easy and difficult cases.
Omega Centauri 08.12.15 at 9:52 pm
Am I miscomprehending the graph? The run under Thatcher sure looks SW to NE to me.
Philip 08.13.15 at 9:55 am
Omega, I would describe at as heading north not northeast, there are barely any gains going to the poorest people. It also important to remember Major started to invest more in public services as a tory pm, the increase in public sector employment helps explain the improvements under Major and Blair. In 97 after the Thatcher years there was some consensus between tories and labour on spending. Now they are in power the tories have shifted to the right and labour could be shifting to the left. It will be interesting to see what happens when enough people get sick of austerity and the tories move back to the centre.
Plume 08.13.15 at 2:33 pm
Thanks, Layman.
Omega Centauri 08.13.15 at 6:13 pm
Its partly the poor choice of graph colors, Thatcher/Major appears as a single segment trending NE. The Thatcher part has a slight easterly trend.
Plucky Underdog 08.13.15 at 9:13 pm
Omega Cen @44 — Thatcher-period income started at £6.2K, went down to 5.6 and then up to 6.5. That’s a 4.8% increase in 11 years or (drumroll) 0.43% annualised. The entire series goes from 4.2 to 8.5 over 50 years, equivalent to 1.4% annualised or 1.7% in non-Thatcher years. That 0.43% is probably below the noise level. Wilson saw white-hot annual growth of 2.6% over his first term. It’s just arithmetic.
Thatcher’s period in office put on 9 Gini points, which is the same as the difference between the 50-year endpoints. Gini’s a funny measure, a lot less tractable than growth rates (where are the mathematical economists when you need ’em, eh?), but surely that number’s got to count for something.
magari 08.14.15 at 1:43 am
I’ll flip through Piketty to see if his data can shed some light on Plume’s concerns. Obviously Gini is supposed to measure inequality, so if the income of the poor increases while the Gini number stays flat, that suggests the poor capturing additional income at roughly the same rate as the rest of society.
cassander 08.14.15 at 3:29 am
To accept this chart, one has to believe that there was dramatic improvement in the quality of life in the UK in the 70s. This was a time, it must be remembered, when the UK was literally unable to keep the lights on for years at a time, and when a bankrupt UK had to go beg the IMF for loans. Even if you don’t think things were actively getting worse (I don’t) it’s hard to argue that they were getting better quite so rapidly. What I see here is not a story of the glorious triumph of british socialism, but the failure of whatever inflation adjustment was used to accurately capture real changes in purchasing power.
dsquared 08.14.15 at 5:25 am
To accept this chart, one has to believe that there was dramatic improvement in the quality of life in the UK in the 70s.
No, one has to believe that there was a sustained improvement in the quality of life for the poorest 10% in the 1970s. As it happens, I’ve got the charts for higher deciles because I asked Tom for them, and they look quite different.
armando 08.14.15 at 9:09 am
Could you post/comment on the charts for the other deciles? That would be really interesting.
trane 08.14.15 at 10:02 am
Thank you for this.
I second Armando’s wish to see charts for the other deciles.
infovore 08.14.15 at 11:33 am
Thirding the wish to see the charts for the other deciles.
Looking through Tom’s twitter feed I think he started with a chart for median income, which shows a clear SW/NE slant during the Thatcher years. But up to the lower 25% or so the pattern is basically a S/N vertical. Stagnation at the bottom, with all growth going to the top. What is fascinating is that only the Thatcher period that stands out like that.
I wonder what similar charts for other countries would look like.
Alex 08.14.15 at 2:01 pm
This was a time, it must be remembered, when the UK was literally unable to keep the lights on for years at a time
All you would need to do to correct this would be to actually visit the link you yourself provided.
from 1 January until 7 March 1974
Plume 08.14.15 at 3:20 pm
Cassander,
Again, the failed experiment of capitalism, which has destroyed hundreds of millions of humans, endless numbers of ecosystems, and more than 50% of animal life on the planet in the last 40 years, had just one middle class boomlet. Prior to that, and after its end in the early 70s, we’ve had accelerating inequality. That boomlet lasted roughly from the late 1940s to the early 1970s in both the Americas and Europe, and had ripples in Asia. Africa has pretty much never had a middle class boomlet in the capitalist era/error. It has pretty much always been a source of wealth for developed nations, but never the beneficiary of its own resources.
So, yes, there was a brief moment in time when the developed world saw some slowing down of inequality. But it didn’t last. The powers that be had their revenge, like the Death Star/Empire striking back. We call it “neoliberalism,” but it’s really just the norm for capitalism. The aberration was the Keynesian Golden Age, and even that was rather limited to white folks.
Plume 08.14.15 at 3:31 pm
Something often lost in any talk of percentages and gains among the deciles. And it’s too obvious to need repeating, but it really seems to be missed all the time.
If the rich gain 10%, and the poor gain 10%, the rich are still pulling away from the poor at light speeds. So it’s worse than disingenuous to speak of “equal gains,” ever — again, for obvious reasons.
If someone making one million gets a 10% raise, she pockets another 100K. Someone making 20K a year pockets 2K, with the same percentage. The top in that case accelerates its lead on the poor, obviously.
Bottom line, it’s ridiculous to pat ourselves on the back and talk of “gains” for the middle and the poor. They haven’t occurred in forty years, unless you leave out the rather important matter of comparisons with other deciles. In reality, the middle and the poor will keep falling further and further behind, until we radically reduce the wage/wealth gap upfront. Before the checks are written. Not when it’s too late, via tax variances and social welfare benefits. And these, of course, always leave out the sometimes hidden social welfare benefits that go exclusively to the rich.
All governments, basically, are in the business of wealthcare, especially in the modern era. The rich start out with an incredible lead, as far as government supports, though these are mostly unmentioned in any economic discussion . . . . at least when it comes to mainstream economists. Those not brainwashed by capitalist fictions are the exceptions to this. They note the staggering sums of money (perpetually) poured over the heads of the rich, taken from the middle and the poor.
Brett Dunbar 08.14.15 at 7:09 pm
Technically Britain didn’t, quite, need to go to the IMF. The treasury initial figures made it look like we did, when the final figures were calculated they were rather better than the preliminary figures.
Stephen 08.14.15 at 7:55 pm
What would really help (or at least help my understanding) would be a series of graphs showing income vs GINI for the lowest 10%, 10th-20th %, 20th-30th % …
Point being, if median income goes up while GINI goes up, by definition income of topmost section increases while income of lowest does not (or at least increases less). Question being, how far down the income scale do we have to look before there is no trickle-down effect?
cassander 08.15.15 at 1:13 am
@Plume
When you’ve been reduced to arguing that living standards were higher in the 70s than today, I think your argument is self refuting. But just in case, I’ll pile on anyway.
>If the rich gain 10%, and the poor gain 10%, the rich are still pulling away from the poor at light speeds. So it’s worse than disingenuous to speak of “equal gains,†ever — again, for obvious reasons.
So, in other words, you define progress for everyone as failure. That explains a lot, actually.
>Bottom line, it’s ridiculous to pat ourselves on the back and talk of “gains†for the middle and the poor.
No, it isn’t. There have been massive, real gains in living standards across the globe, for all classes of people, in almost every country. No amount of manichean fantasizing by you, or yearning for the glory days of maoist enthusiasm, will change the fact that the neoliberal era you so detest has seen the largest increase in human living standards in history.
Plume 08.15.15 at 1:59 am
cassander @58,
I wasn’t talking about “living standards,” and you know it. I was talking about reducing inequality across the board. The late 1940s through the early 70s was the only time in capitalism’s catastrophic history that this happened. But way to shift the goal posts.
But even if we are talking about “living standards,” it all depends upon how you define it. If you’re talking about buying power for the poor and the middle class, then they were significantly better off during the Keynesian Golden Age. Of course, if you define “living standards” by access to cheap goods and gadgets of dubious quality and no lasting value, and forget about the massive increases in health care costs, education, transportation, housing and the fact that most of that cheap stuff is on the credit card . . . then, yeah, sure. It’s better now. Except, of course, you neglect the fact that one single bread-winner was all it took back then (to stay in the middle class), whereas it takes two or more now . . . .
Yep, the neoliberal era/error is much, much better for the poor and the middle. Riiiiight. Just take a look at the massive accumulation of debt to fund those “higher living standards” and more than twice the work hours. Take a look at how many people now have to work in order to have the buying power of one single bread-winner from the late 1940s until roughly 1973.
No amount of capitalist spin is going to change the facts, Cassander. No amount of capitalist BS is going to change the fact that the richest 20% of the world’s population consumes 85% of its resources; the richest 400 Americans hold more wealth than the bottom 60%; just 80 human beings hold more wealth than half the human population; and three billion people live on $2 or less a day. Shake your pom poms all you want. It won’t change the fact that your precious capitalism has created mass starvation, poverty, death, destruction and ecological catastrophe on a scale never before witnessed in human history.
Plume 08.15.15 at 2:43 am
And, of course, the example of a gain of 10% at the top and the bottom was only for the purposes of showing that even this radically increases income and wealth disparities. In reality, the bottom and the middle aren’t coming anywhere near matching raises at the top. It’s not at all close.
In the 1950s, the average CEO made roughly 20 times the rank and file. In the 1960s, it was 25 times. Today? It’s in the 300-400 times range . . . and if the CEO is in a Fortune 100 company, it’s more than a thousand times.
(Larry Ellison in a typical year makes 10,000 times more than his rank and file).
Obviously, workers haven’t kept up — the understatement of the decade. Not even in terms of percentages of their income. And back then, back in the 1960s America, the richest 1% took in roughly 8% of all income. Today it’s nearly 25%. Again, obviously, the gap has accelerated well beyond a matching percentage.
Before and after our one and only middle class boomlet, which was really a white male middle class boomlet, inequality has accelerated dramatically. The graph above? I think it obscures the facts, while people like Harvey, Wolff, Piketty and Stiglitz have brought them to the fore.
Take away the second bread-winner, the credit cards and the multiple mortgages, and the middle class all but disappears. We get obscene highs and obscene lows, then. The right-libertarian’s dream.
a different chris 08.15.15 at 1:46 pm
>will change the fact that the neoliberal era you so detest has seen the largest increase in human living
I don’t see any slope difference between 1960-1980 compared to the rest. But if you think the first half of the chart is the “neoliberal” era we’ll just have to disagree.
cassander 08.15.15 at 6:49 pm
@plume
>I wasn’t talking about “living standards,†and you know it. I was talking about reducing inequality across the board
And my point is that this is insane. As long as everyone is getting richer is good. It is not bad just because some people are getting richer faster than others.
> by access to cheap goods and gadgets of dubious quality and no lasting value,
access to goods and services is literally the definition of living standard. Buying power means what it costs you to buy goods and services, and by that standards the wages of the poor buy more stuff today than in the 70s, period.
> forget about the massive increases in health care costs, education, transportation, housing and the fact that most of that cheap stuff is on the credit card
the cost of health/education have not gone up, we buy much more of those things, and that’s good. As for transportation, the costs of that have actually gone down, not up, but you’ve repeatedly made it clear you have no need for research so I’ll let that one slide for now. Housing is perhaps the only place where costs have actually increased, but that’s hard to know for sure, because the amount of housing square footage per person has risen dramatically so you don’t have a real apples to apples comparison.
As for debt, the overwhelming majority of the debt is in housing, an area of economic activity where government meddling has only increased, not decreased, over time, and where massive government subsidies accelerate the cost spiral.
>. Take a look at how many people now have to work in order to have the buying power of one single bread-winner from the late 1940s until roughly 1973.
From the 40s to the 70s, the labor force participation rate a little under 60%, it rose to 65% by the mid 80s. Definitely a large shift, but nothing like the picture you paint. And since then, it’s continually declined. But who cares about facts, right?
>Today it’s nearly 25%.
More like 12.5%, according to the CBO, but who cares about facts, right?
Kiwanda 08.15.15 at 6:58 pm
Cassander says things are great, because the curve moves to the right, with higher living standards for the bottom 10% over time. Plume says everything is terrible, because the curve moves to the top, with greater inequality over time. Well, yeah.
The evidence about Thatcher vs. e.g. Blair (increasing inequality but little wage growth under Thatcher, and vice versa under Blair) corresponds to the consistent observation of better economies under Democratic presidents.
Watson Ladd 08.15.15 at 8:04 pm
Plume, imagine we burnt down every millionaire’s house, and smashed their cars, etc, and the next day woke up and had exactly the same incomes as before, minus the millionaires. How exactly would our life be improved?
Stephen 08.15.15 at 8:35 pm
Plume: “capitalism’s catastrophic history”.
Don’t know when you think capitalism started, but I suspect that going back from current C21 capitalist living standards to mediaeval feudal standards might be more than a little inconvenient.
Kiwanda 08.15.15 at 9:16 pm
“Plume, imagine we burnt down every millionaire’s house, and smashed their cars, etc, and the next day woke up and had exactly the same incomes as before, minus the millionaires. How exactly would our life be improved?”
Well, if this were the U.S., it would then be something closer to a democracy instead of an oligarchy. So there’s that. Especially if the millionaires included corporations (after all, they’re people).
But that’s a strange scenario: why would we non-millionaires have exactly the same incomes as before? If the resources controlled but not consumed by the millionaires were destroyed, we’d be much worse off. If those resources were re-distributed, we’d be much better off.
Layman 08.15.15 at 9:27 pm
“the cost of health/education have not gone up”
This is nonsense on steroids.
Julie 08.15.15 at 10:25 pm
“access to goods and services is literally the definition of living standard.”
Really? I can’t imagine how shallow your life must be. But perhaps BB King says it best;
“I think I’ll give up living and go shopping instead”.
If your ever so helpful and benign capitalists, would just stop making the awesome stuff for us – like that CocaCola and fast food that is simply poison, that would be a good start to the road to a better standard of living.
Seriously I have thought about every poor person I know and I cannot see any benefit that they or I have gained from having coca cola in the shops.
In reality coke kills local communities. For example, a couple of decades ago, the small family owned drink factory that supplied the local area, and where my husband at the time worked, was taken over by coca cola and within 3 years that factory had gone bust leaving a large number of employees out of pocket and out of work.
Seriously things are not better for ‘the poor’ now than they were before we had so much stuff to worry about. Life is not improved because I can now borrow enough money to buy a stainless steel fridge that makes ice cubes.
You might learn something if you actually talked to some poor people rather than continue to believe ‘you’ are more intelligent and you can see what ‘we’ need and that having obscenely rich and obviously stupid people tell lies about how clever and good they are is not a problem for the poor.
Collin Street 08.15.15 at 11:31 pm
You might learn something if you actually talked to some poor people rather than continue to believe ‘you’ are more intelligent and you can see what ‘we’ need and that having obscenely rich and obviously stupid people tell lies about how clever and good they are is not a problem for the poor.
If only someone had put forward a framework that explained and predicted poor empathy in right-wingers!
Julie 08.16.15 at 12:14 am
We won’t see this ‘lacking empathy disorder’ in the DSM any time soon because most of those who construct that diagnostic system suffer from this ‘disorder’.
But perhaps Freud’s defence mechanisms are all that is needed to explain the cognitive mechanisms in which hierarchical individualistic self-serving people project their own motivations, desires and beliefs onto all other people.
These are people who have managed to remain wilfully ignorant of the fact that human beings have a drive to protect themselves from negative assessments and that this tendency is what makes us crooked; it is the drive to understand and critique those tendencies to put ourselves before and over other people that straightens us out.
That is the progress, the growth that raises living standards for all.
cassander 08.16.15 at 2:22 am
@Julie
>Really? I can’t imagine how shallow your life must be. But perhaps BB King says it best;
Funny, I don’t remember saying material standard of living was the sole purpose of life, but you clearly think I have. Perhaps you could point out where I said that?
>Seriously I have thought about every poor person I know and I cannot see any benefit that they or I have gained from having coca cola in the shops.
So, the tens of millions of poor people who buy coke are, what, too stupid to know that it doesn’t improve their lives? Forced to buy it at gun point? tricked into drinking something they don’t like by insidious advertising? Geeze, talk about pretension.
>In reality coke kills local communities. For example, a couple of decades ago, the small family owned drink factory that supplied the local area, and where my husband at the time worked, was taken over by coca cola and within 3 years that factory had gone bust leaving a large number of employees out of pocket and out of work.
An excellent example of tunnel vision of the sort bastiat so elegantly skewered. The reason the small factory went out of business was, of course, that the people in the town prefered drinking coke to whatever they were making. So, while I certainly feel bad for the employees that lost their jobs, their welfare does not outweigh the welfare of everyone else in the town, to say nothing of the tens of millions living in towns without small soda makers, or with soda makers that make shitty soda.
>Seriously things are not better for ‘the poor’ now than they were before we had so much stuff to worry about. Life is not improved because I can now borrow enough money to buy a stainless steel fridge that makes ice cubes.
If you don’t think getting richer is actually good for people, then why on earth do you care so much about who is rich and who is poor?
>You might learn something if you actually talked to some poor people rather than continue to believe ‘you’ are more intelligent and you can see what ‘we’ need
coming from someone who just said millions of poor people buy stuff that makes their lives worse. this is laughable. I don’t know how you type stuff like this without feeling like you need to take a shower after.
Plume 08.16.15 at 2:37 am
Cassander @62,
Even your own CBO link doesn’t say that the top 1% took in 12.5% of all income. It says 16.9%, which is the lowest estimate I’ve seen anywhere.
Piketty and Saez put it at 22.46%, as of 2012:
http://inequality.org/income-inequality/
From that same page, a graph going from 1913 – 2012
http://inequality.org/wp-content/uploads/2014/09/GIMP-Top-1p-Share-of-Total-PTI.png?9aeac0
Plume 08.16.15 at 2:43 am
And, are you kidding about health care and education? You don’t think they’ve skyrocketed? Then you haven’t been living in America for the last few decades.
I went to university in three different decades, beginning in the 1970s. When I started, I could go full time for a few hundred dollars a semester. In a couple of states, like California and New York, state universities were free at that time. Today, it costs tens of thousands for kids to go to school, and they now hold a combined student debt of well over one trillion.
Medical costs? A million Americans go bankrupt each year due to those costs, and half of them have insurance. A single session of chemo today costs 30K in much of the country, and a chemo regimen usually means six of those a year. Anyone who has actual experience with health care costs over the course of the last few decades knows full well that prices have skyrocketed. It’s not debatable.
Plume 08.16.15 at 2:46 am
Watson Ladd @64,
Given that no one was talking about burning down houses and smashing cars of the super-rich, your question is a silly non-sequitur in search of . . . . of . . . I have no idea what.
Julie 08.16.15 at 2:51 am
OMG Cassander is that the best you can do? It is only in your imagination that you could suggest that everyone else in the town ‘chose’ to drink coke and that is why the factory shut down. Choice? Do tell me why you choose to respond to me as if I was as stupid and shallow as you?
What is really puzzling though is the claim that capitalists produce coke to make people’s lives better? Are not capitalists supposed to be the best they can be when they are thinking only of your own self advancement? You know about self-interest don’t you?
It is supposed to be the stupid and lazy people who just happen to benefit when a high IQ person such as yourself just thinks of a wonderful product and makes it happen all by themselves? So perhaps if you kept your coke for yourselves and it didn’t rot my kids teeth and give them too much sugar for a healthy diet, things could be better for we povo’s.
That’s an Aussie term for poor people; once we used to call them people who were down on their luck but then neo-liberalism took over.
I’m happy for there to be rich people if they shut the fck up about how stupid and lazy people like me are and if they stopped buying my government and forcing me to live and work in an economy that makes them even richer and as far as I can see it is the case that everything that makes them rich seems to calculated to make me and mine poorer in spirit and self-respect.
It’s not the wealth I mind; it’s the poverty of their lives and aspirations that poisons the well for the rest of us; particularly our young people who find it more difficult than fully adult people do to ignore the propaganda and lies with which you steal everyone’s ambition for real progress and subvert this human striving for growth into to an admiration for the things that the shallow rich value.
And wow ending with a gratuitous nasty little insult about how I type and having to shower? wtf do you think that says about you? I can see why few people bother with you.
Plume 08.16.15 at 2:56 am
And, Cassander,
It’s nonsense to claim “everybody’s getting richer.” It’s simply not true. As demonstrated, the poor and the middle are losing ground against the cost of living, and have been since roughly 1973. And when compared with the rich, the losses are staggering.
Again, some actual facts — something you’re quite averse to:
http://inequality.org/income-inequality/
and
And the impact of inequality on health and life expectancy. Inequality actually kills:
http://inequality.org/inequality-health/
Julie 08.16.15 at 3:09 am
and this?
“coming from someone who just said millions of poor people buy stuff that makes their lives worse. this is laughable.”
So your shallow and simplistic thinking leads you to conclude that because human beings are such that they like to be social and do what the group does (drink coke because things go better with coke) they are stupid?
That would suggest that all the marketing that coke does and did was not needed because it just is the case that coke tastes better than the soft drink made by the family company that had made soft drinks for the region for over 50 years and word would have spread like wild fire among the people and all that was needed was for them to choose the foreign import over the local product.
Alan White 08.16.15 at 3:18 am
I used to ask my students what were the two largest drug cartels, based on the deliberate shilling of products on discount to garner reliable customers to make the largest profits. They’d say something related to heroine or cocaine or marijuana of course. But of course it’s really Coke and Pepsi.
But now (of course as well) I have to also add–bottled water. We can be lured to be addicted to anything.
Plume 08.16.15 at 3:26 am
Julie,
As you know, Cassander is waaaay off the mark when he says access to cheap shit is the way we quantify “living standards.” No. It’s not. Everything depends upon what can be bought, not just any random stuff on the shelf. But he does epitomize what Marcuse was talking about in One Dimensional Man, 50 years ago.
Apparently, we are what we buy. Or can buy. And, of course, to corporations, we don’t exist as human beings at all. We’re just anonymous “things” who use plastic cards with lots of numbers on them, and wind up as a different set of numbers on Excel sheets — or some alternative data collection. All entirely replaceable. As is the case in our capacity as workers, too. Descartes’ “I think therefore I am” becomes “I buy so that others may think I am,” and “I work so I can buy so others may think I am.”
Capitalism commercializes life out of existence and replaces it with numbers.
cassander 08.16.15 at 3:50 am
@Julie
>What is really puzzling though is the claim that capitalists produce coke to make people’s lives better?
A claim I never maid. but you show that straw man who’s boss!
>It is supposed to be the stupid and lazy people who just happen to benefit when a high IQ person such as yourself just thinks of a wonderful product and makes it happen all by themselves? So perhaps if you kept your coke for yourselves and it didn’t rot my kids teeth and give them too much sugar for a healthy diet, things could be better for we povo’s.
I don’t even know what you’re trying to argue here. If you don’t like coke, don’t buy it, it’s as simple as that.
>I’m happy for there to be rich people if they shut the fck up about how stupid and lazy people like me are and if they stopped buying my government and forcing me to live and work in an economy that makes them even richer and as far as I can see it is the case that everything that makes them rich seems to calculated to make me and mine poorer in spirit and self-respect.
You’re the one arguing the poor are too stupid not to buy things that make them unhappy, not me. I think people buy things that they want, and that people getting what they want is a good thing. You seem to think people should get what you want. How you so seamlessly project that desire to control others onto me is beyond my understanding, I’m not capable of so much self delusion.
>So your shallow and simplistic thinking leads you to conclude that because human beings are such that they like to be social and do what the group does (drink coke because things go better with coke) they are stupid?
Yes, jumping off a bridge because your friends are doing it is stupid. But you’re the one who thinks the poor are doing it, not me.
@plume
>. As demonstrated, the poor and the middle are losing ground against the cost of living, and have been since roughly 1973. And when compared with the rich, the losses are staggering.
No, they aren’t. They are getting more of literally everything.
>Again, some actual facts — something you’re quite averse to:
This isn’t a fact, plume, it’s a statistical construct, a time series built out of 1000 different assumptions. It is trumped by the much harder data on actual consumption. Compared to the 70s, everyone is living in larger houses, going to the doctor more, living in bigger houses, driving more and better cars, and so on. This is utterly indisputable. If you were right and wages weren’t meaningfully rising, then in order to pay for the consumption that is unquestionably increasing, people would have to be getting less of something, somewhere. They aren’t.
>. Inequality actually kills:
Funny how both life expectancy and inequality are rising in most parts of the world. But as we’ve established, you don’t care about facts
>As you know, Cassander is waaaay off the mark when he says access to cheap shit is the way we quantify “living standards.†No. It’s not. Everything depends upon what can be bought, not just any random stuff on the shelf.
yet another argument I never made. I’m not sure who you guys think you’re arguing with, but it isn’t me. But feel free to prove me wrong. Which goods commonly bought today are lower quality than those of the 70s?
cassander 08.16.15 at 4:01 am
@plume
>Even your own CBO link doesn’t say that the top 1% took in 12.5% of all income. It says 16.9%, which is the lowest estimate I’ve seen anywhere.
That’s pre-tax income. Post tax income matters more, since contrary to your past claims, the rich do pay taxes.
>And, are you kidding about health care and education? You don’t think they’ve skyrocketed? Then you haven’t been living in America for the last few decades.
The amount we spend has skyrocketed, that is not the same thing as cost. If you buy more of something, you spend a lot more money, but the cost is not rising. You could not buy Arthroscopic surgery at any price in 1970. That you can buy it today, and many do, is a good thing.
>I went to university in three different decades, beginning in the 1970s. When I started, I could go full time for a few hundred dollars a semester. In a couple of states, like California and New York, state universities were free at that time. Today, it costs tens of thousands for kids to go to school, and they now hold a combined student debt of well over one trillion.
Yeah, it’s almost like modern schools employ many more people, offer many more services, have much more luxurious facilities, and so on! We are buying much more than we used to and calling it all education. If all you wanted was some guy wearing tweed and a chalkboard, you could still get that for 3oo bucks a semester.
Julie 08.16.15 at 4:45 am
Cassander
No you didn’t make the claim; the commenter known as Swami said something like that and I’ve been looking for a way to reconcile that with the whole ideology of libertarianism, ever since. But you came in quite soon after, on that comment thread, as I remember it and were happy to go with the general theme that stuff that capitalism makes *is* good for people.
” but you show that straw man who’s boss!”
Like Plume, I don’t believe in being the boss; I don’t believe in bosses at all. No masters , no guru’s no neo-liberals. You are projecting your own personality traits and preferences onto others again.
“You’re the one arguing the poor are too stupid not to buy things that make them unhappy, not me”
I am arguing that the poor have no choice in what to buy; rich people who want more and more monetary wealth use this wealth to force the poor to choose to drink their crap poison drinks and eat their crap ‘food’ and other useless products.
How can they choose to eat and drink well when there is no information available to them that tells the truth about how things just don’t go better with coke?
But lets get this clear, do you think that poor people are stupid to drink coke or are they smart and freely choosing to drink an overpriced poisonous liquid – and all the other poisons that the good capitalists produce for our consumption – possibly just because these smart poor people are choosing to get diabetes and fat and bad teeth and heart disease later on?
cassander 08.16.15 at 5:06 am
>wealth to force the poor to choose to drink their crap poison drinks and eat their crap ‘food’ and other useless products.
When you say things this transparently foolish, you exhaust even my patience. This was a bad argument when galbraith said that it proved GM could never go bankrupt. Today, it’s simply embarrassing.
>How can they choose to eat and drink well when there is no information available to them that tells the truth about how things just don’t go better with coke?
They don’t have schools? Internet? libraries?
>But lets get this clear, do you think that poor people are stupid to drink coke or are they smart and freely choosing to drink an overpriced poisonous liquid –
You mean like, say, alcohol, a far more potent poison that people of all income levels have been enthusiastically ingesting for something like 12,000 years?
People do not always do what is best for them. Despite this, I still think a system that gives people what they want is best, because while people don’t always know what’s best for them, they almost never know what’s best for other people. You, on the otherhand, are seem certain you know what is best for others. you say that like plume, you reject the idea of bosses. Like plume is a good description, because he too tells himself he’s an anarchist to justify his authoritarian streak. You don’t hate the idea of bosses, you clearly want to boss the coke people right out of business. what you hate is the idea of someone you don’t like being the boss. You’re a puritan through and through, haunted by the fear that someone, somewhere, may be enjoying something you think is bad. and like all puritans, you’re an authoritarian, desperate to save them whether they like it or not.
Julie 08.16.15 at 5:13 am
Plume
I don’t think Cassander has a hope in hell of understanding Marcuse. :(
He’d need to read someone with a high IQ and social class to critique the ideas.
As for products that were better in the ’70’s. Screwdrivers and cheap spanners and all cheap tools from the big box hardware stores are crap now; they break and the price and even the brand is no signal as to quality.
Cheap food and drinks as I have already mentioned are crap and cause the increase in health problems that is happening in all western countries.
Cheap clothing made by poor people in Bangladesh is crap, don’t fit and the fabric is uncomfortable and ugly. Synthetic fabrics make people’s sweat stink.
Julie 08.16.15 at 5:19 am
Cassander,
“When you say things this transparently foolish, you exhaust even my patience”
When you say things like that I laugh because you sound just like a foolish old man. Why not walk away dude? Ignore me. Piqued or something like that are you?
The Aboriginal people who inhabited the continent in which I live – Australia – did not make any sort of alcohol.
I suppose you think they did not do this because they were too stupid to do so – are you a HBDer? – but it is far more likely that they were so happy with their lack of possessions and the way of life that provided them, that they did not desire to alter their consciousness and blot out the pain that people like you cause to other people who are less able to protect themselves from your lack of patience and all the other inhuman qualities that you value.
engels 08.16.15 at 7:23 am
‘how exactly would our lives be improved’
Less distortion of the political process, better access to scarce goods like housing and a slower rate of ecological destruction for starters.
Plume 08.16.15 at 2:00 pm
Cassander @83,
Like most righties, you don’t understand just how authoritarian you are, because you think it can only happen in the public sector — and you don’t understand how crucial the state is for your economic system of choice. You don’t believe private power can be authoritarian. It is. And it’s the root for it. You also are so firmly in the grip of McCarthyism — sixty years after it died for most sentient beings — that you just can’t conceive of actual anti-authoritarians on the left. Well, sorry to burst your silly little bubble, but we invented the idea and the practice, and unlike righties, we understand it needs to be aimed at both public and private “authority.” Both. Not one or the other. And, as has been mentioned to you a thousand times before, I and my fellow leftists are far more anti-state/anti-authoritarian than you could ever dream of being. We want the state and class to go the way of the dodo bird. We don’t even want a “minarchist” state. Our goal is true democracy, including the economy, and the break up and dispersal of all centers of power, public or private. We realize, unlike you, that as long as capitalism exists, even “smaller government” is impossible. Because no economic system in the history of the world has ever needed Big Gubmint to such an extent.
Of course, we also know your ilk with forever be stuck in three monkeys mode.
Plume 08.16.15 at 2:16 pm
Also, Cassander:
I’ve wasted all too much time debating righties online and in the real world. But, I’ve rarely run into someone who is so blindly loyal to the fiction of magic capitalism, to the ridiculous idea that “everyone” is getting richer and doing better, year after year. The vast majority of diehard, capitalist-loving righties I’ve talked with — even they acknowledge that some Americans are struggling and doing worse. Not you. You use the word “everyone” frequently, and you come off sounding like the authors of those despicable old school texts that tried to describe slavery as a paradise even for the slaves.
Seriously, do you ever bother to read what you post? Anyone who has actually lived in America for the last few decades knows full well that “everyone” does not progress economically, year after year, that tens of millions struggle and fall further and further behind, that their cost of living outpaces their paychecks. That’s reality. What you present is pure fiction and fantasy. It’s the Heritage Foundation on steroids.
Oh, and education costs have exploded because states have radically slashed the money that once went to paying tuition for kids. Beginning in the 1970s, with the Revenge of the Death Star (neoliberalism), states slashed taxes for the rich and slashed public expenditures for everyone else, especially higher ed. That’s why tuition has skyrocketed. Not because state colleges suddenly started to give “consumers” tens, hundreds or thousands of times more for enrolling. It’s really amazing that you could even attempt to rationalize this on the basis of supposedly greater offerings, given the massive cuts in public funding for those colleges. Where did they get all of this money, when their main source of funding was gutted?
Since this is online discussion, and we don’t know each other, our different life contexts, our varying life experiences, I have no way of knowing if you actually believe what you write. But I can say with certainty that if you do believe it, you don’t have any clue whatsoever as to the life experiences of the vast majority of Americans. If you do believe that “everyone” is getting richer, then you’ve been living in some exclusive cave for the rich and privileged and have never seen the light of day.
engels 08.16.15 at 3:22 pm
…and they taste good with Chianti
Btw made this point on the other thread but this seems to show inequality levelling off around 1990 and median income growth picking up in Major’s last years – so it hardly seems like an advert for Blairism, although it might help to explain its popularity.
engels 08.16.15 at 3:35 pm
(& much as I dislike John Rawls I’m not sure I’d want to infer much about political philosophy from one country’s income history over half a century)
cassander 08.16.15 at 4:26 pm
@plume
>Anyone who has actually lived in America for the last few decades knows full well that “everyone†does not progress economically, year after year, that tens of millions struggle and fall further and further behind, that their cost of living outpaces their paychecks. That’s reality.
No, that’s fantasy. I’ve shown you the statistics, plume. they are inarguable. you have responded to them by calling me names and saying “nu-uh”.
>Oh, and education costs have exploded because states have radically slashed the money that once went to paying tuition for kids
> If you do believe that “everyone†is getting richer, then you’ve been living in some exclusive cave for the rich and privileged and have never seen the light of day.
That’s the thing plume, I don’t have to believe, I have data. You are the one clinging to a belief well past the point of reason or empiricism, not me. You’re a proud credit to the reality based community!
Layman 08.16.15 at 4:36 pm
“I’ve shown you the statistics, plume. they are inarguable. ”
I think if you stop looking at workforce participation in the aggregate, and instead look at it by age group, you’ll find plume is more right than you are about the trend. The increase in workforce participation in the prime adult group is substantial, while the decline is among the young and the old – and they’re leaving the workforce only because there are no decent jobs for them.
Layman 08.16.15 at 4:44 pm
See the growth in labor force participation among 25-54 year olds, i.e. the core of marriage-age adults. Two earner families are much more common now than in 1950, because they’re necessary as wages haven’t kept pace with growth.
https://research.stlouisfed.org/fred2/series/LNU01300060
Plume 08.16.15 at 4:46 pm
Cassander @91,
Data? What data? You’ve never provided one iota of data to “prove” your absurd assertions. And how could you? It doesn’t exist. There is no data, anywhere, that says “everyone is doing better,” even using your distorted version of “doing better.” That appears to boil down to nothing more than “buy more stuff,” and even that is far from true. The best case you could make is that some people are doing better and buying more stuff. But it’s beyond absurd to say “everyone” is. And I think, down deep, you know this is the case.
That’s what the inequality issue is all about. The few versus the many. You, for some bizarre reason, conflate the two.
More stats that shred your argument to nano-bits:
Top 1% receiving all the post-recession gains
Take a good look at the graph, and note that it excludes capital gains. Capital gains, of course, being a very large portion of income for the rich. Note, also, that when people like Piketty and Saez calculate these percentages and changes based upon IRS data, they aren’t getting the whole picture. A great deal of wealth and income goes unreported at the top. The IRS itself estimates it loses several hundred billion a year in taxes due to this absence. Off-shoring, Cayman Islands, nano-trades, international trades, etc. etc.
djr 08.16.15 at 4:54 pm
engels @ 89
It depends on whether you think these statistics have “inertia” or not. My guess would be not a lot – any particular policy change might contribute to the change over some number of years, but not to creating a trend that would just continue absent any effort to stop it.
If two of the last three years of Major predicts the trend for the first 5 years of Blair, does the last year of Callaghan predict the overall trend of the Thatcher era?
b9n10nt 08.16.15 at 5:01 pm
Cassander: “People do not always do what is best for them. Despite this, I still think a system that gives people what they want is best, because while people don’t always know what’s best for them, they almost never know what’s best for other people.”
So, as an obvious counter-example: drinkable, running water into every domicile. The existence of such is much more attributable to “people knowing what is best for other people” than it is “[giving] people what they want”. Across the face of the earth, people have not created the medical/nutritional foundation of our rise in living standards by acting as individual consumers whose desires have been aggregated by private capital.
Rather, these are commonly public works, protected from the marketplace.
Relatedly, if people want to choose Coke or Pepsi, fine. But observe the existence of advertising for these products, and the methods employed by the advertisements. These ads target arational, associative/emotional drives rather than appealing to our equally-natural ability to reason and evaluate. Yet, if the “invisible hand” that aggregated individual choices into mass produced consumer goods is to be socially benign, the “fulcrum” of our choice must itself be rational, and not be prejudiced against our own true needs. We are not a self, we are many selves. Which selves are allowed to participate in the market is a thoroughly social choice.
Thus, advertising really should be viewed as a kind of coercive, “visible hand”: an intruder in the market place. To what degree does the very existence of advertising demonstrate that the capitalist logic of individual choice has been turned on its head?
The airwaves are a commons, the view from a street or highway is a commons, the Internet is a commons. And so even a free-market liberal should be able to muster the theoretical ratinonale for arranging these commons so as to promote a rational self interest that, via market aggregations, promotes the common good.
And of course, given the epidemics of diabetes and obesity in the U.S., this is not an academic critique of capitalism and living standards. This critique of consumerism isn’t even the main point:
The presence of trans-generational inequality in a marketplace full of private actors means that scarce resources will be channeled away from those who have lost the lottery of birth and toward those have won. Without public works, private actors would compete for installing reverse-osmosis water systems for the rich and offer various buckets to the poor. A system to be driven by individual preferences for the benefit of social welfare must have some means to generate effective equal demand among participants, at least for most essential goods. Otherwise, the “invisible hand” simply won’t exist for a large segment of the society that it purports to serve.
Thus even a free market liberal should be a strident advocate for a social leveling of each successive generation. She should have no difficulty with an egalitarianism of childhood education, healthcare, nutrition, and emotional stability. Let the doctor gain access to marginal high prestige goods without letting the janitor go without, and let the public provide the basis for the doctor’s and janitor’s children to attend the same schools and live in the same neighborhoods, etc…
So that’s my capitalist utopia.
engels 08.16.15 at 5:08 pm
Djr, I’m not saying Major caused the horizontal section from 93/4 to 2002/4, just that Blair can’t have.
Plume 08.16.15 at 5:08 pm
Cassander @81,
As you know, this forum was started by academics. I doubt you’d find any who would agree with your description of changes to their workplaces. In fact, I would be very surprised if they didn’t tell you it’s the opposite case. That rank and file staff have been cut, their salaries lowered, more and more profs becoming temps instead of full-timers . . . and if there have been upgrades in “luxuries,” the vast majority of that has gone to athletic departments.
As mentioned, I attended universities in the 1970s, 80s and 90s. I saw no such uptick in what I purchased. In fact, I saw smaller classes in the 1970s and early 1980s than in subsequent decades. Of course, that’s just anecdotal and personal observation. But I’ve searched for data that syncs up with your description and can’t find any. As with all of your other contentions, you couldn’t find it, either, or you would have posted it.
Instead, you pulled it out of your . . .
Brett Dunbar 08.16.15 at 6:02 pm
Actually it doesn’t seem that arthroscopic surgery is beneficial. I remember hearing about a double blind study of arthroscopic knee surgery (the control group received sham surgery) that failed to find any evidence of benefit over physiotherapy.
Brett Dunbar 08.16.15 at 6:04 pm
http://www.nejm.org/doi/full/10.1056/NEJMoa1305189
I believe this is the paper. I tried to post the url as a link, but it didn’t work.
cassander 08.16.15 at 8:54 pm
@b9n10nt
>So, as an obvious counter-example: drinkable, running water into every domicile. Rather, these are commonly public works, protected from the marketplace.
well, first, I’m not aware of many people who don’t want running water. second, public water systems are not protected from markets, they’re established outside of them and usually priced well below market rates.
Third, and this is most important, I said there are few cases where benefit is not immediately obvious, not none. I am not an anarchist. If the left would restrict itself to providing genuine public goods, like sewer systems, I’d be an enthusiastic leftist.
>But observe the existence of advertising for these products, and the methods employed by the advertisements.
And do this advertisements sway you? Or do you rise above them? And if you escape them, why do you assume others cannot?
More concretely, ads are not magic, they work at the margins. they do not make you get up and buy things, they make it so that when you do buy something, you think of one product before another. As I said earlier, the galbraithian argument of manufactured demand is largely illusory. If it weren’t, new products would never enter the market in large numbers.
>Thus, advertising really should be viewed as a kind of coercive, “visible handâ€: an intruder in the market place. To what degree does the very existence of advertising demonstrate that the capitalist logic of individual choice has been turned on its head?
None at all. Someone shouting “best eggs in all the land” in a market stall is not forcing you to buy his eggs, even if it false and he says it very persuasively. Perfect information is no more necessary to making markets function than massless frictionless cannonballs are to using ballistic equations to hit targets.
>The airwaves are a commons, the view from a street or highway is a commons, the Internet is a commons. And so even a free-market liberal should be able to muster the theoretical ratinonale for arranging these commons so as to promote a rational self interest that, via market aggregations, promotes the common good.
Absolutely, though spectrum, at least, could be easily privatized. Again, if the left would restrict itself to policing commons and refrain from policing the the size of my soda, I’d join up in an instant. Unfortunately, they do not.
>Thus even a free market liberal should be a strident advocate for a social leveling of each successive generation. She should have no difficulty with an egalitarianism of childhood education, healthcare, nutrition, and emotional stability.
Just because such leveling is desirable does not mean that it is possible. Something, like “equal emotional stability” simply cannot be ensured. Others, can only even theoretically be created by a massive state apparatus. But that apparatus does not exist in a vacuum. Of the 2.2 million teachers in the country, one of them is the best. If the state, rather than money, decides whose kids he teaches, then people will fight for control of the state for the benefit of their kids.
Now, you might say that’s fine, because the state can be egalitarian since it’s driven by democracy not markets, but this does not hold up empirically. There are far fewer people in a father or grandfather’s spot on the Fortune 500 list there are senators and congressmen in their daddy’s seat. Caroline kennedy gets a lifetime of sinecures and nearly a senate seat just because of her name, do you think hard nosed businessmen are just going to hand billions of dollars to Bill Gates’ kids? markets are not perfect, but the existence of those imperfections is not evidence that they can be corrected by non market actors.
@ plume
>. That rank and file staff have been cut, their salaries lowered, more and more profs becoming temps instead of full-timers . .
I really shouldn’t indulge you, but just for fun I decided to look up the number of post secondary teachers in 1980 and today. 606000 in 1983, 1.3 million today in 2012, a dramatic increase in per capita terms. As for pay, the median figure today is 69000, with 90% making 35k or more. Now, if you want to claim that pay was a lot higher in 1980, feel free, but only if you do the work of looking through old census reports for the figures. Given your history of invention, you should not be trusted to make any claim more controversial than that the sky is often blue.
https://www.census.gov/prod/2/gen/96statab/labor.pdf
http://www.census.gov/compendia/statab/2012/tables/12s0616.pdf
engels 08.16.15 at 9:40 pm
“markets are not perfect”
Just remember folks GFC was 7 years ago.
Julie 08.16.15 at 9:46 pm
Cassander
” markets are not perfect, but the existence of those imperfections is not evidence that they can be corrected by non market actors.”
So the market, as you conceptualise it, cannot function in the presence of a democratic government that expresses the will of the people? The invisible hand develops some sort of palsy when it comes up against the most important traditional institution of western civilization?
I love your chutzpah; the way you can imagine that you are being indulgent and having fun looking up stuff. Way to go; never concede always escalate.
cassander 08.16.15 at 10:31 pm
@Julie
>So the market, as you conceptualise it, cannot function in the presence of a democratic government that expresses the will of the people?
Sure, I said that. It was right after I said we should murder all the immigrants and sell their organs to china.
>I love your chutzpah; the way you can imagine that you are being indulgent and having fun looking up stuff.
Well, julie, what can I say, not all of us can achieve your and plume’s zen like transition beyond all need for evidence and facts.
Plume 08.16.15 at 10:51 pm
Cassander @101,
You must be getting desperate, finally realizing you haven’t been able to prove your fictions. So now you’re left with arguing about post-secondary teaching numbers, even though I said “rank and file staff,” which includes more than just teachers?
But even there, you lose. The undergrad student population in 1983 was roughly 10 million. As of 2012, that number had doubled, to roughly 20 million. A huge increase in students mean you need to hire more teachers. And the stats you link to don’t say anything about the stability or status of their jobs.
Now, how does the above come remotely close to proving your absurd contention that costs for students have skyrocketed because they’re getting so much more?
Julie 08.16.15 at 11:03 pm
Cassander,
“Well, julie, what can I say, not all of us can achieve your and plume’s zen like transition..”
How do you know what you can do unless you try?
And it it not only zen that offers people a way of transitioning to a state space in which they don’t need to be a boss to fit in to the group and be a human being who matters.
As for evidence and facts; there is increasingly convincing evidence that reveals the cognitive processes that provide you and people with your personality disorder the ability to maintain faith in the dysfunctional beliefs you have about the world and it’s people. These beliefs are not based on *my* reality so I call it ‘stupid’ when you make assumptions about the ‘other’ people not like you but like me, and the evidence you rely on is collected on the basis of stupid assumptions so they lead to facts that are only facts if you still believe in the old paradigm.
You ask What can you say?
You could answer in simple terms the questions I have asked. Remember I am poor so I must be stupid and lazy :) and I may seem to be asking rhetorical questions in an ignorant and rude way, but that may be because of my poor person personality disorder and not because I am un-interested in how you as a member of your group rationalise your behaviour.
I am actually very interested in the way you can ignore the evidence that doesn’t fit with your belief system.
Plume 08.16.15 at 11:09 pm
Julie,
This TED talk by Yuval Harari gives us a great many hints about Cassander and his fictions. I think he’s really on to something.
Val 08.16.15 at 11:40 pm
@ Cassander
I’m interested in the subject of workforce participation, so I did a little on-line research.
The general trend of rising participation rates from the 1950s until around 2000 seems common in US, UK and Australia. Largely this appears to be driven by women’s increasing participation, somewhat masking declines amongst men and young people, especially as more young people move into higher education.
Since then there appears to have been some decline, particularly in the US, smaller in UK, not really evident in Australia. In the U.S. the highest rate appears to have been about 67% around 2000, which has now fallen to about 63%, somewhat lower than comparable countries.
Falling participation rates may reflect more people receiving income support because of disability, particularly in older age groups (I am not sure if this is the case in US, it is a slight trend here), and people who are discouraged (often those who have some spousal or family support, give up looking for work and do not seek unemployment benefits). Some older people take early retirement where they can/can afford to, although this trend may be decreasing in Australia.
I don’t agree with the claim (suggested by Plume’s comments above, though probably not intended) that increased participation of women is related to increasing costs of living alone (though it may be related to increased housing costs), as there are many other reasons why women choose to participate in paid work. However in Anerica at least, there appears to have been little increase in real wages for many workers in recent years, so in that sense what Plume says is true – both members of couples have to work to maintain their living standards.
However one more proviso – at least in Australia, the way census information prior to about the 1970s-80s probably disguised much of women’s participation in paid work, which was probably more common than census figures show, particularly for working class women. I think it’s likely to have been true in US and UK too though I don’t have evidence of that.
So overall it’s complicated, but I don’t think you can disprove Plume’s claims on the basis of participation rates, as you tried to do above.
(I haven’t provided links as there are too many, but you can google most of this information. Re the Australian census, I did some research on this some years ago.)
Val 08.16.15 at 11:43 pm
Sorry, in my third to last para, should read ‘the way census information was recorded prior to about the 1970s-80s’.
Julie 08.17.15 at 12:02 am
Plume
I haven’t listened to the talk yet, but you might find this worth reading; it seems to be along the same lines.
http://www.pnas.org/content/108/Supplement_2/10918.full
From the abstract;
“The cognitive niche hypothesis overestimates the extent to which individual human cognitive abilities allow people to succeed in diverse environments and misunderstands the role that culture plays in a number of important ways. We suggest, instead, that our uniquely developed ability to learn from others is absolutely crucial for human ecological success. This capacity enables humans to gradually accumulate information across generations and develop well-adapted tools, beliefs, and practices that no individual could invent on their own. We have entered the “cultural niche,†and our exploitation of this niche has had a profound impact on the trajectory of human evolution. In the remainder of this article, we will develop this argument in more detail.”
cassander 08.17.15 at 12:10 am
@julie
>I am actually very interested in the way you can ignore the evidence that doesn’t fit with your belief system.
Since you haven’t presented any actual evidence, you don’t actually know anything about whether or not I ignore it. But lack of actual evidence has never stopped you before, so I’m not surprised it hasn’t now.
@plume
>But even there, you lose. The undergrad student population in 1983 was roughly 10 million. As of 2012, that number had doubled, to roughly 20 million. A huge increase in students mean you need to hire more teachers. And the stats you link to don’t say anything about the stability or status of their jobs.
You mean we’re consuming more education? And that means we’re spending more money? You know, exactly what I said a post or two ago and you said was ridiculous? This isn’t even moving goalposts, it’s literally arguing the point I was making earlier.
cassander 08.17.15 at 12:47 am
@val
>However in Anerica at least, there appears to have been little increase in real wages for many workers in recent years, so in that sense what Plume says is true – both members of couples have to work to maintain their living standards.
Well, first I don’t accept that there has been a real wage stagnation. I am aware that some statistics show that, but others do not and the consumption data definitely doesn’t.
But let’s put that aside. The picture plume paints is women moving into the labor force en-masse to support their standard of living, but an overall rise from 60 to 66% participation does not support his story, it’s just not big enough. Nor does the continual decline in male LFP, which persisted even during the 90s boom. If we worked at 60s levels, there’d be about 10% fewer people working, lot but not the titanic shift plume describes, particularly if you’re right that female LFP hasn’t grown as much as the formal stats say.
Watson Ladd 08.17.15 at 1:22 am
cassander, revenue at a college increases linearly with the number of students. Pointing to increased populations doesn’t explain why the costs have to rise as much as they have. The real story is one of refusing to discipline middle management and its empire building tendencies.
js. 08.17.15 at 1:29 am
As I understand it, at least part of this, and perhaps a lot of it, has to do with the fact that the post-2000 “recovery” wasn’t terribly good at creating jobs. And then of course the post-2008 “recovery” was much worse at creating jobs. (Which, yes, Cassander, is definitely totally Obama’s fault.)
Val 08.17.15 at 1:56 am
@112
As I said, I don’t think Plume intended to suggest that women moved into the paid workforce only (or even mainly) to support a standard of living. But I think his actual contention, that in families now many parents have to keep working (and in particular, working longer hours than they might like) to maintain their standard of living, is probably justified particularly in the American context.
The point about consumption doesn’t really prove anything much, I think. Consumption is presumably related to disposable income, and could just show that there is a proportion of the population that has a lot of disposable income, rather than that it is spread across the population. This would be in line with the general trend of increasing inequality since the 1950s, also.
Another thing in support of Plume’s argument is that a lot of the income women (or whichever parent has previously been the primary child carer) earn when they go back to work, is spent on goods and services that may increase GDP and appear as greater consumption spending, such as child care, transport costs to work, more clothing for work, more spent on pre-prepared or packaged foods, and domestic services. However these don’t necessarily reflect higher standards of living, in some cases they simply reflect the movement of work from the unpaid, domestic sector to the paid, market or state sphere.
As I said, I think there are many more important reasons why women do paid work, but it’s important not to confuse growth in money exchange with growth in living standards. They are not exactly the same thing.
Val 08.17.15 at 2:02 am
I also think that the point about parents/mothers having to work more than they might like is particularly relevant in the US because of the lack of universal paid maternity leave provisions.
Plume 08.17.15 at 2:39 am
Cassander @111,
Yes, it’s moving the goalposts. Obviously. Your claim was that costs skyrocketed for individual students because they were getting so much more in return, including “luxuries” which you have yet to describe . . . . More students going to college doesn’t explain the massive increase per student in costs. Per student. You’re mixing the aggregate with the particular and acting as if it’s the same thing.
But I already explained to you the main reason for the increase. State support for tuition has been gutted. That is the main reason for ever escalating student costs, and nothing comes even remotely close. Not your specious nonsense about some massive increase in “consumption.” Not your silly argument that students today get so much more during their time at school — enough, apparently, to justify tens of thousands of dollars per year in costs. Not your absurd suggestion that we have so many more teachers and such, or Watson Ladd’s suggestion that it’s bloated bureaucracy that caused it.
It’s the radical slashing of state support for public higher ed. Period. End of story.
Oh, and btw, during the period in question, the American population increased by more than 80 million. That we added just 10 million more students during that time is nothing to brag about. Of course, if we did the right thing, if we followed the lead of much of Europe, we’d have free tuition at least in all public colleges and universities. Then we would be “consuming” more higher ed, though I think that word is absurd in that context. For cheerleaders of capitalism, however, no part of life escapes its cancerous reach, including education.
cassander 08.17.15 at 2:47 am
@val
>As I said, I don’t think Plume intended to suggest that women moved into the paid workforce only (or even mainly) to support a standard of living. But I think his actual contention, that in families now many parents have to keep working (and in particular, working longer hours than they might like) to maintain their standard of living, is probably justified particularly in the American context.
“some people are working more than they’d like because they want money” is not a meaningful statement. Plume claimed that it now took two people to provide the standard of living that one used to. That it implies that we now have many more people working than in the past, which we don’t. About 20% of those that used to not work are now working, but 8% of those who used to work have stopped. a 12% shift in non workers isn’t nothing, but it’s not world changing either.
Plume is also flatly wrong on the consumption side, the two working now have a massively higher standard of living, but that’s a separate question.
@Watson Ladd
>Pointing to increased populations doesn’t explain why the costs have to rise as much as they have. The real story is one of refusing to discipline middle management and its empire building tendencies.
If you double the size of a school, you will more than double the number of full time administrators right out of the door. And after, as you say, they will reproduce like bacteria unless closely monitored. But even if you assume that the per student increase is small or zero, the effect on education spending, either in terms of government budgets or share of GDP, is huge, which is what many of the statistics talking about increasing costs are actually measuring.
Plume 08.17.15 at 2:58 pm
Cassander,
Your insistence on this is bordering on insanity, and shows you are completely divorced from the reality of American life.
“Massively higher standard of living”? Complete and utter bullshit. How on earth is a median household income of roughly 50K, which is actually lower than it was 40 years ago, adjusted for inflation, do that? And for single people, living alone? The median is 28K.
You can’t possibly know anyone in the working class, nor have you ever experienced economic struggles or poverty yourself. I have. I have direct experience with it, and every time you insist that “everyone” is doing better, you insult tens of millions of Americans . . . . while making yourself look ridiculous.
Layman 08.17.15 at 4:01 pm
“That it implies that we now have many more people working than in the past, which we don’t. About 20% of those that used to not work are now working, but 8% of those who used to work have stopped. a 12% shift in non workers isn’t nothing, but it’s not world changing either.”
Each of these statements is false, as least as relates to your argument. You’re wrong, because you continue to look at labor force participation in the aggregate. We do in fact have more people working now than in the past. The increase in labor force participation among prime-age workers has increased by much more than 20% since 1948. The percentage of those 55 and over who are working is also rising, because they must work in order to survive. The only age group with declining work force participation is the young, because there are no jobs for high schoolers anymore, and relatively fewer jobs for young people in general. Adults now work in part-time jobs once done by school kids because they have to.
Layman 08.17.15 at 4:04 pm
“In the U.S. the highest rate appears to have been about 67% around 2000, which has now fallen to about 63%, somewhat lower than comparable countries.”
FFS! Labor force participation for 25 to 54 year olds – which is to say, the group where you find married couples! – is over 80%, up from around 60% in 1948. What’s wrong with you?
Plume 08.17.15 at 4:10 pm
Layman,
Very true.
I haven’t researched this, and would love to hear from people who have . . . . but it makes sense to me that women weren’t always even counted as a part of the workforce, so their absence wasn’t a normal part of the total percentage. It is now. I could be wrong about that, but I don’t think so. My guess is government projections in the past assumed women wouldn’t be in the mix, would be at home, primarily . . . which makes me think of Katrine Marçal’s recent Who Cooked Adam Smith’s Dinner, which sounds like a very important read.
Publisher’s blurb:
This is on my shortlist of new book purchases.
engels 08.17.15 at 4:18 pm
Just checked back in to see if anyone had anything to say about a topic which I thought was both important and interesting: inequality and income levels under different UK governments.
Bravo, Cassander. I’m sure you’ll be amply rewarded.
Val 08.18.15 at 4:01 am
Layman @ 121
“In the U.S. the highest rate appears to have been about 67% around 2000, which has now fallen to about 63%, somewhat lower than comparable countries.â€
FFS! Labor force participation for 25 to 54 year olds – which is to say, the group where you find married couples! – is over 80%, up from around 60% in 1948. What’s wrong with you?
is this directed at me? Because you know I was actually using the figures cited by Cassander to show that his arguments were unfounded.
Partly the reason I used those particular figures (16-64), even though there are obviously some problems with them, is that it was difficult (perhaps not impossible, but not feasible within the time I have to spend on blogs) to find comparable figures going back to the 1950 for specific age groups by sex.
Plume – the figures I have cited are for total participation and include women at both times, although they probably under-represent women’s participation in paid work in the earlier periods, as I also said. I have actually researched this issue for my MA in Australian social history. The issues are probably a bit different in different countries, but there are probably some important parallels too.
Val 08.18.15 at 4:03 am
Just to make it clear – the first two paras in #124 above, down to “What’s wrong with you?” were from Layman, not me. Block quote fail.
Layman 08.18.15 at 4:56 am
“is this directed at me? ”
No.
Val 08.18.15 at 6:01 am
Ok – it was me that actually used those words, though as I’ve said, I was aiming to show where Cassander was wrong, not support his arguments. Where did your figures come from, I’m interested to have a look?
Val 08.18.15 at 6:02 am
engels – I actually did also have a look at the UK figures briefly – recognising that’s where the debate started – just have limited time as I said
Layman 08.18.15 at 1:48 pm
“Where did your figures come from, I’m interested to have a look?”
https://research.stlouisfed.org/fred2/series/LNU01300060
Layman 08.18.15 at 1:57 pm
“Ok – it was me that actually used those words”
Sorry, that was sloppy of me.
The numbers are available by gender as well, so if you’re interested in the rate at which women joined the labor force, you can get at it directly. Using the aggregate participation rate, as Cassander does, disguises what’s happened – many more married couples both working, the rate peaking at about 85% just before the financial crisis. It is down slightly from that peak, largely because of the lack of jobs and the impact of long-term unemployment.
Plume 08.18.15 at 3:52 pm
Some more stats on women entering the workforce:
http://www.mckinsey.com/client_service/organization/latest_thinking/unlocking_the_full_potential.aspx
and on production that isn’t counted but should be:
https://www.bea.gov/scb/pdf/2012/05%20May/0512_household.pdf
. . .
Oh, and I never suggested that women entered the workforce for any particular reason. Their reasons for doing so, I’m guessing, differ(ed) on a case by case basis, but are likely similar to their male counterparts overall. I was talking about effects, not intentions or rationales. To know the latter requires mind-reading capabilities that none of us has.
Val 08.19.15 at 11:39 am
@130
No worries. How do you get the breakdowns by sex for that age group though? I couldn’t see that age group by male and female.
@131 Plume
I didn’t think you were suggesting any particular reason, it’s just that it could have been read that way. But as far as “mind-reading” – you don’t have to be a mind reader, you just have to ask. My research didn’t look specifically at that question (why women wanted to go back to paid work after having children) but I’m sure there’s research that did and does.
(I looked a bit at when they wanted to go back, which varied quite a bit, but none of them had really wanted to go back to paid work full time before the baby was one year old, even where they had actually done so, showing again the importance of maternity leave. This was a small scale qualitative oral history project with 18 women as part of a larger historical study on maternity and work)
Thanks for the link about non market work. Our Bureau of Statistics does some work on this too and includes unpaid household work and voluntary community work, which in total they estimate to be worth about 50% of the value of market/paid work. http://www.abs.gov.au/Ausstats/abs@.nsf/Lookup/6CD7146F4D3CAFC9CA256A790082D9FC
I still think that they are probably under-estimating its value, because of ideological/habitual thinking/epistemological reasons, but at least it’s a start.
There’s a good article by Marilyn Waring about the limitations of economic statistics and their gendered nature, I think I’ve mentioned it before but will send the link again if I can later.
Comments on this entry are closed.