A really interesting chart, via Tom Forth on that Twitter. It plots inequality in the UK against the income of the poorest 10%, as a time series.
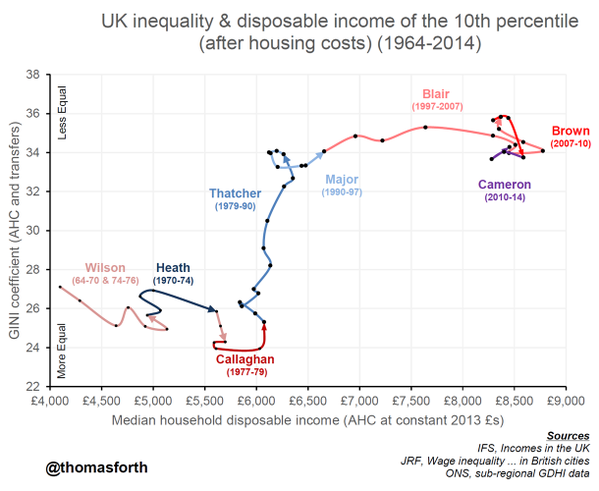
This is a perfect application of interocular trauma econometrics – it hits you right between the eyes. It’s all up-and-down or left-and-right. The sort of thing that generates the difficult cases for liberal political philosophy – increases in inequality which nevertheless benefited the worst-off, which would have showed up as a southwest-to-northeast upward slope – never happened.