Mike Hout and some colleagues at Berkeley have a working paper called “The Effect of Electronic Voting Machines on Change in Support for Bush in the 2004 Florida Elections”. A summary is also available as well as the data itself. Hout is a well-respected sociologist, so if he thinks the data for Florida show some anomalies he’s worth listing to. Hout et al try to estimate whether the presence of touch-screen electronic voting made a difference to the number of votes cast for Bush, controlling for various demographic characteristics of the counties as well as the proportion of votes cast for the Republican Presidential candidate in 1996 and 2000. Here’s the punchline:
bq. As baseline support for Bush increases in Florida counties, the change in percent voting for Bush from 2000 to 2004 increases, but at a decreasing rate. Electronic voting has a main, positive effect on the dependent variable. Furthermore, there is an interaction effect between baseline support for Bush and electronic voting, and between baseline support for Bush squared and electronic voting. Support for Dole in 1996, county size, median income, and Hispanic population had no significant effect net of the other effects. Essentially, net of other effects, electronic voting had the greatest positive effect on changin percent voting for Bush from 2000 to 2004 in democratic counties. … Summing these effects for the fifteen counties with electronic voting yields the total estimated excess votes in favor of Bush associated with Electronic Voting; this figure is 130,733.
Hmm. I’m going to go mess around with the data for a while and see what we can see.
*Update*: OK, I’ve looked at the data, and so have others. I think the case is not proven. More below the fold.
*Update 2*: Mike Hout has added a comment below.
While mucking around with this, I see from the comments that Andrew Gelman (Statistics, Columbia) has done the job for me. He presents a very nice discussion of these patterns on his blog. You should read all of his post. Here’s a figure, similar to one on his blog, that shows the percent swing to Bush in Florida counties in 2004 against the Percent Republican vote in 2000 in the same counties. (A PDF version is also available.)
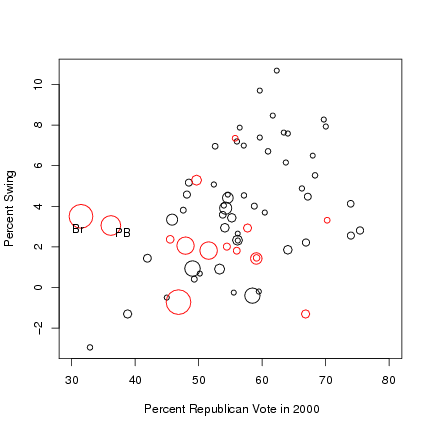
Counties using electronic voting machines are shown in red. You can see that Broward and Palm Beach counties (which have very large populations and lean strongly Democratic) swung much more toward Bush than was typical for counties where Republicans won less than 47 or 48 percent of the vote in 2000. It turns out that these two counties are driving the findings of Hout et al’s model. I ran a model identical to Hout et al’s, but with a variable (“pb-brow”) added to distinguish Broward and Palm Beach Counties from all the others. Here are the results:
Coefficients:
Estimate Std. Error t value Pr(>|t|)
(Intercept) -2.13e-01 9.49e-02 -2.24 0.0289 *
b00pc 1.03e+00 3.25e-01 3.17 0.0025 **
b00pc.sq -6.62e-01 2.83e-01 -2.34 0.0230 *
size -2.88e-08 7.21e-08 -0.40 0.6908
etouch 2.98e-01 3.26e-01 0.92 0.3638
b00pc.e -8.82e-01 1.13e+00 -0.78 0.4373
b00pcsq.e 6.02e-01 9.71e-01 0.62 0.5377
d96pc -1.58e-01 1.19e-01 -1.33 0.1881
v.change -4.41e-08 3.21e-07 -0.14 0.8912
income -7.89e-07 7.64e-07 -1.03 0.3064
hispanic -5.21e-02 3.10e-02 -1.68 0.0988 .
pb-brow 2.14e-02 5.23e-02 0.41 0.6831
—
Signif. codes: 0 `***’ 0.001 `**’ 0.01 `*’ 0.05 `.’ 0.1 ` ‘ 1Residual standard error: 0.0215 on 55 degrees of freedom
Multiple R-Squared: 0.539, Adjusted R-squared: 0.447
F-statistic: 5.84 on 11 and 55 DF, p-value: 3.55e-06
As you can see, putting in a dummy for Palm Beach and Broward Counties makes the significant effect of “etouch” (i.e., whether a county had electronic voting) go away. Now the only variables significant at conventional levels are the ones measuring the percentage voting for Bush in 2000. (Note that there’s also a hint of an effect for ‘Hispanic,’ as befits their ambiguous role in deciding the election.)[1]
So, all of the e-voting action is explained by two counties. The question is what’s happening in those counties. Andrew Gelman again:
bq. One possibility, as suggested by Hout et al., is cheating, possibly set up ahead of time (e.g., by loading extra votes into the machines before the election or by setting it up to switch or not count some votes) … but an obvious alternative explanation is that, for various reasons, 3% more people in those counties preferred Bush in 2004, compared to 2000. As can be seen in the graphs above for 2000, 1996, and 1992, such a swing would be unusual (at least compared to recent history), but that doesn’t mean it couldn’t happen! … It would make sense to look further at Broward and Palm Beach counties, where swings happened which look unexpected compared to the other counties and compared to 2000, 1996, and 1992. But lots of unexpected things happen in elections, so we shouldn’t jump to the conclusion that e-voting is related to these particular surprises.
In other words, if there is cheating it’s not centralized cheating where all the e-voting machines mess up in the same way. If you believe that the machines were rigged, focus on the ones in Palm Beach and Broward county. But it seems more likely that these results show the Republican Party Machine was really, really well-organized in Palm Beach and Broward, and they were able to mobilize their vote better than the Democrats. The general swing toward Bush in Florida seems consistent with this story.
*Notes*
A version of the analysis presented here is available in PDF format. The two models can be compared directly in that document.
fn1. Again, this analysis isn’t original to me: see Andrew Gelman’s post for more details.
{ 23 comments }
Ken Houghton 11.19.04 at 9:21 pm
What is the effect of electronic voting on waiting time? Was that one of the variables?
Donald A. Coffin 11.19.04 at 9:49 pm
Let me preface this with the statement that I really, really wanted Kerry to win.
Looking at their working paper, and some of the plots, I find it interesting that in 2004, Bush’s vote was higher than expected in counties in which he did poorly in 2000 and lower than expected in counties in which he did well in 2000. This suggests to me some sort of modeling problem, or, at the very least some sort of non-linearity in the “true” model. (I know that had I found something like that while taking econometrics, my professor would have raised questions…of course that was more than 30 years ago, and things may be different now.)
Chris Lawrence 11.19.04 at 10:20 pm
The thing that sticks out at me, right off the bat, is the inclusion of the squared term; you only do that if you expect some sort of quadratic relationship, and I can’t think of any good reason to a priori assume that Bush 2004 support is a quadratic function of Bush 2000 support. And, even if there is one, the authors don’t supply this justification, which reeks of specification-searching.
Andrew Gelman 11.19.04 at 10:26 pm
It’s really all happening in two of the counties. You can take a look at our pictures and discussion at http://www.stat.columbia.edu/~cook/movabletype/archives/2004/11/vote_swings_in.html
neal caren 11.19.04 at 10:42 pm
I think there’s a problem with collinearity among the independent variables in the Hout et al. analysis. Their model has some very severe multicollinearity problems (several VIFs over 100) as it involves four variables that are highly correlated (bush vote %, bush vote % squared, bush vote % interacting with machine type, and bush vote % squared interacting with machine type).
With four variables that are so similar (and with such a small sample size), it is very difficult to discern the unique impact of any one variable. The traditional solution to such a problem (when it is caused by including a variable and its square) is to center the variables on zero. I did this to bush vote % and then recomputed the three other variables. When I then reran their analysis with the new variables, the sign of the critical variable (evoting machine) switches from positive to negative, and is no longer significant.
There is presumably also a more sophisticated way to model a county’s decision to adopt a touch screen technology, as a sort of move-stay model, although I’m not sure how this would alter the results.
It is safe to say that if every sociologist made their study this easy to reanalyze, sociology would be a lot better, but I wouldn’t get much of my own work done.
Chris Lawrence 11.19.04 at 11:15 pm
First cut analysis: if you remove the squared terms, you get substantively the same results. Which makes the inclusion of the squared terms even more bizarre (but more innocent, at least).
It seems like most of the counties that adopted touch-screen voting were the most populous; there’s so much collinearity between county population and voting system I don’t know you can tease anything out, beyond “Bush outperformed his 2000 tally in urban counties more than he did in rural ones,” which makes sense since he already had a large vote share in rural ones and there wasn’t much more to get.
dsquared 11.19.04 at 11:33 pm
At first glance, this looks like the Rigobon & Haussmann analysis of the Venezuelan referendum, which was a good piece of statistical work albeit that it didn’t seem to explain the data very well. I haven’t taken a second look, so I don’t know what to think.
Just one point; “bush” may be correlated with “bush^2”, but the relationship between a number and its square isn’t linear, so I don’t think that these two variables could be considered to be collinear.
ogmb 11.20.04 at 1:01 am
“bush†may be correlated with “bush^2â€, but the relationship between a number and its square isn’t linear, so I don’t think that these two variables could be considered to be collinear.
They’re approx. linear in the [0.4, 0.6] range, which is presumably where most of the data points lie (if “bush” is vote% for GWB. Haven’t looked at the study yet).
A Simple Citizen 11.20.04 at 3:51 am
This was what I posted on another Blog when we were talking about Broward on Nov. 10, 2004. I don’t know when these numbers were posted on Broward’s Election site, but this is what it was when I looked at it 11/10/04.
2000 (66.23% turnout)
588,107 total ballots cast — 563,846 for B & G
B: 177,328 (30.93%)
G: 386,518 (67.42%)
2004 (still unofficial) (68.75% turnout)
709,630 total ballots cast — 698,455 for B & K
B:244,638 (36.61%)
K:453,817 (64.21%)
B: +67310
K over G: +67299
134,609 ballot difference from 2000-2004. Each received 50% of the total. I’m just sayin’ it’s a little too coincidental. Thanks for letting me post.
ogmb 11.20.04 at 3:54 am
Still didn’t read the study (and increasing thinking it might not be worth it), but anybody who wants to analyze Optical vs. eVote results needs to restrict themselves to counties with 40,000-600,000 registered voters. The smallest county with eVote is Sumter (40,532 reg. voters), the largest with OpScan is Orange (531,774). I don’t know how anyone would want to draw inferences from counties outside this range, as they have no approximate match in the respective control group.
yami 11.20.04 at 5:13 am
I know it would be a huge pain to collect the data, but other than that, why isn’t this being done on a district or precinct level? Seems like you could get better demographic controls that way.
tib 11.20.04 at 2:38 pm
yami,
FL makes precinct data available by county. I am not sure all counties have posted results (FL Dept. of State has links http://enight.dos.state.fl.us/). Also, ncec.org collects precinct level results for most races.
Zaoem 11.20.04 at 4:24 pm
You probably can’t do the analysis on the precinct level because precincts are usually not constant across elections.
TomF 11.20.04 at 7:17 pm
I am almost certain that, immediately in the wake of the election, someone said/wrote that Bush had way outperformed his 2000 vote in Broward and Palm Beach, and that some of this was the result of a swing in support from Jewish voters because of Isreal and the mid-east. Given what’s said above– that the entire shift is explained in Broward and Palm Beach– I’d look at that possible explanation, first.
msk08 11.20.04 at 10:09 pm
What exactly is a “working paper”?
Kieran Healy 11.20.04 at 10:16 pm
What exactly is a “working paper�
It’s a paper that is paying its debt to society rather than leeching off of the teat of the state.
[Try the veal, I’m here till Thursday.]
It’s just a paper circulated for comment and subject to revision. It’s not your first draft, but it has yet to go through the peer-review process and get published in a journal.
Anthony 11.21.04 at 5:54 am
Dan Weintraub, the “California Insider“, quotes an email which points out that there is an alternate explanation for the results: Democratic party cheating with punch-card ballots depressed the Bush vote in 2000 in the two or three counties with the biggest variations, and such cheating was impossible using electronic voting machines.
Alex 11.21.04 at 2:24 pm
Unfortunately, I think the Berkley study is flawed. It does not account for the increase of Republican voters between 2000 and 2004. See
http://alex.strashny.com/2004/11/electronic_voting_machines_florida_and_bush_votes_in_2004.html
esp 11.21.04 at 6:40 pm
I’m reminded of a time in the late 60’s during my graduate studies in statistics when our campus hosted a visit by a noted non-parametric statistician. He talked about his analysis of a particular data set and told us that his findings had hardly been noted by the academic community, but that his data had been quoted repeatedly.
I am now retired from teaching, but if I were in the classroom you can bet my students would all be taking a crack at the Berkeley data. I very much appreciate the UC group’s making the data available to us. From the looks of this blog we are about to wear it out.
As for their analysis, I’d give it high marks if it were an undergraduate paper, lower marks if it were a graduate paper, and I must consider it borderline delusional as a research consortium effort.
Craig Newmark 11.21.04 at 7:03 pm
I think commenter tomf hits the nail on the head. The model doesn’t account for a possible switch in the Jewish vote, a vote which is exceptionally large in those three counties.
If variables to control for the number of Jewish residents are included in the model, the electronic voting variables become insignficant.
For details, see the post on my blog, http://newmarksdoor.typepad.com/mainblog/2004/11/more_on_the_stu.html
Jim Miller 11.23.04 at 1:17 am
Curious what different patterns different people find. I saw the surge in votes for Bush this year in Palm Beach county as evidence for fraud in 2000. You can find a post on my site explaining why, if you are not familiar with that argument.
By the way, strong Republican votes in Palm Beach are not unprecedented. I believe George H. W. Bush carried the county in 1988. That’s one of the many, many reasons Republicans (and open minded Democrats such as Pat Caddell) suspect fraud there in 2000.
Alex 11.24.04 at 12:06 am
esp,
***As for their analysis, I’d give it high marks if it were an undergraduate paper, lower marks if it were a graduate paper, and I must consider it borderline delusional as a research consortium effort.***
Exactly! If this was an undergrad paper, I’d say, great job. :))
Mike Hout 11.25.04 at 6:17 pm
Colleagues,
We do not claim that our results show cheating. I cannot think of a way that stats could be definitive on that question. We have tried to stick to words like “discrepancy” and “statistical anomaly” to communicate how open to interpretation these results are. Personally I suspect hardware or software errors.
In interviews and public comments since seeing Andy Gelman’s plots, I have stressed that Broward and PB are key to the results.
This brief note does not address all your concerns, I know. We are working up an FAQ and blog site to help us manage the flood of correspondence we are getting. It is too soon to predict when it will be working.
Comments on this entry are closed.