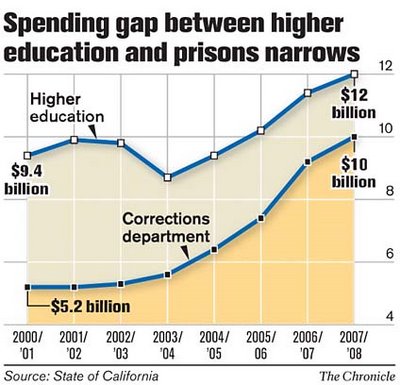
Last weekend I read Prophet of Innovation, Thomas McGraw’s biography of Joseph Schumpeter. Maybe more on that later: I need to write something about it before I forget the content. Somewhere in there McGraw quotes Schumpeter’s line that “the budget is the skeleton of the state, stripped of all misleading ideologies.” With that in mind, here’s a kind of X-ray of California’s state budget, via Chris Uggen.
This is from a SF Chronicle article on these trends, which look set to continue.
Over the past few years, sociologists Bruce Western and Becky Pettit have shown that incarceration has become a standard feature of the life-course for certain segments of society, especially young, unskilled black men. A paper by Pettit and Western provides some estimates, notably the astonishing finding that in the cohort born between 1965 and 1969, thirty percent of black men without a college education — and _sixty_ percent of black men without a high school degree — had been incarcerated by 1999. Recent cohorts of black men “are more likely to have prison records (22.4 percent) than military records (17.4 percent) or bachelor’s degrees (12.5 percent).” Western develops the argument at greater length in a recent book, Punishment And Inequality in America, which you should really go and buy. As these shifts show up in the social patterning of individual biographies, so too will they be reflected in the Schumpeterian skeleton of the state budget.
{ 29 comments }
rd 05.29.07 at 5:19 am
The jump in prison spending is so steep after 2003 that I suspect you’ve got some kind of a cave in to the notoriously politicized prison guards union going on. Or maybe there was just some kind of tipping point related to the third strikes law.
rd 05.29.07 at 5:27 am
I guess I should have just read the SF Chronicle article first and confirmed my own suspicion:
“He said that one of the key drivers was the fact that the state pays the guards and other prison employees far more than any other state, a policy choice the state had made in past years.”
For “policy choice,” read the “corrections unions raised hell and the governor and legislature got in a bidding war trying to satisfy them.” So, the situation is a perfect storm combination of the worst of right and left politics. Mindless tough on crime policies coupled with public sector unionism running rampant.
luci 05.29.07 at 6:20 am
The total budget is $100 billion – the $10 and $12 billion above are significant portions. $40 goes for K-12 education, $30 billion for Health and Human services.
As to rd’s point above – what percentage of “corrections spending” goes to wages for union workers, as opposed to construction of new prisons, salaries for non-union professionals, food, subcontracted services (with non-union workers), etc.? I can’t imagine the marginal effect of paying the unionized workers (slightly?) more than unionized corrections officers in other states accounts for much of a difference.
Richard 05.29.07 at 6:48 am
Oh my god – what happened to the education budget in 2003?
Oh, right. I wonder if Schwarzenegger has anything to do with this.
SG 05.29.07 at 7:50 am
Kieran, can that 30%/60% of black men with a prison record vote once they have attained this significant milestone in their life course? Or is losing the right to vote related to the crime for which someone is convicted, not the presence/absence of prison time?
JK 05.29.07 at 8:29 am
It’s a depressing trend.
One point on the graph itself, the vertical scale really should start at zero, not four. A doubling of spending on corrections should be striking enough. The impression of quintupling is horribly misleading.
(Sorry. Bad graphics are a pet hate.)
Stuart 05.29.07 at 11:05 am
In what sense does not having a large amount of empty space at the bottom of a graph make it ‘bad’. If you did so then you reduce the quality of information presented by squeezing the actual part of the graph of interest into a smaller area, making the trends (and the details/variation within them) less clear.
Matt 05.29.07 at 11:17 am
For a very interesting political philosophy take on some of the discussion people might like Tommie Shelby’s recent paper, “Justice, Deviance, and the Dark Ghetto” in the Spring 2007 (vol 35 issue 2) issue of Philosophy and Public Affairs. I don’t know that I’d endorse all of what he says (for whatever _that_ might be worth) but it’s a very interesting take on what this sort of situation does on political legitimacy.
lemuel pitkin 05.29.07 at 11:59 am
can that 30%/60% of black men with a prison record vote once they have attained this significant milestone in their life course?
Yes. In California, you do not lose your vote for a felony conviction. The states that disenfranchise people with a criminal record are mostly in the South.
Stuart 05.29.07 at 12:24 pm
Yes. In California, you do not lose your vote for a felony conviction. The states that disenfranchise people with a criminal record are mostly in the South.
Just think, if the South also got to the point of having 40% of the blacks having been disenfrancised this way it would be back to them having 3/5ths of a vote (although progress in the sense that its not the slave owners getting to use those votes I guess).
Kieran Healy 05.29.07 at 12:48 pm
Yes. In California, you do not lose your vote for a felony conviction. The states that disenfranchise people with a criminal record are mostly in the South.
The best recent work on felon disenfranchisement is Chris Uggen and Jeff Manza’s Locked Out: Felon Disenfranchisement and American Democracy.
abb1 05.29.07 at 1:00 pm
Obviously they should combine incarceration with higher education and save big.
Barry 05.29.07 at 1:21 pm
Posted by Stuart: “In what sense does not having a large amount of empty space at the bottom of a graph make it ‘bad’. If you did so then you reduce the quality of information presented by squeezing the actual part of the graph of interest into a smaller area, making the trends (and the details/variation within them) less clear.”
If a graph starts at 0, it better displays the changes in the curves relative to the whole amount. This is paid for, of course, by reduced graph area to actually display the changes.
Depending on circumstances, either starting at zero or at the lowest point on the curves displayed can be valid (or invalid).
Nat Whilk 05.29.07 at 2:10 pm
Re #4: The 2003/2004 California State Budget was signed by Governor Gray Davis on August 2, 2003.
Stuart 05.29.07 at 2:46 pm
Depending on circumstances, either starting at zero or at the lowest point on the curves displayed can be valid (or invalid).
I agree, but my point was in reference to this particular graph and the statement that it was a bad graph just because it didn’t go through 0 and therefore gave an impression of the value ‘quintupling’, which presumably is unlikely for anyone reading the above graph (especially when the start/end values of $5.2 and $10 for that particular trend are explicitly added onto the graph).
Running through zero on a graph can be necessary in some cases, and if its sufficiently close to the base of the graph it should be added anyway for simplicity, but if you have to add 50% to the height of your graph just to get the origin to be 0, then its unlikely to be a good idea. If you went back in time with the series and had values of 2 to 12 on the scale, then expanding it back to 0 might be reasonable, but either way the values shown on the graph are very clear as it is, even to a cursory glance.
eudoxis 05.29.07 at 2:52 pm
Remember, California has a Proposition 98 baseline for funding education. The 2007 budget for Prop 98 is 57 billion dollars. Prop98 includes funding for community colleges, with 6 billion proposed for 2007. The budget proposals in the graph, above, do not include this baseline funding. About a third of Prop 98 funds come from property taxes. That leaves 4 billion for higher education spending on top of the 12 billion proposed.
Still, there are way too many people incarcerated in California. Many of them for trivial things.
Dan Simon 05.29.07 at 3:53 pm
here’s a kind of X-ray of California’s state budget
Has anybody tried to estimate the distribution by socioeconomic class of the benefits of a marginal dollar spent on the prison system vs. the higher education system? It would be very tricky to estimate the deterrent effect of money spent on the prison system, of course, but I’d think that the benefits of higher education dollars would be so skewed towards the middle and upper classes, and the benefits of reduced crime towards the lower classes, that even assuming very modest deterrent effects, the prison dollars would still be more redistributive.
A paper by Pettit and Western provides some estimates, notably the astonishing finding that in the cohort born between 1965 and 1969, thirty percent of black men without a college education—and sixty percent of black men without a high school degree—had been incarcerated by 1999. Recent cohorts of black men “are more likely to have prison records (22.4 percent) than military records (17.4 percent) or bachelor’s degrees (12.5 percent).”
Two thoughts:
(1) The rate for black men seems to be declining–presumably that means that the major sentencing crackdown of the 1980s and 1990s had at least some effect. The obvious question is whether the decline is slow but steady, indicating that the overall strategy is working, or whether it’s flattened, indicating that new strategies are in order. What do the figures say?
(2) I’d like to see the incarceration rates for black men without high school diplomas compared with the corresponding rates for white men. Given the relative ease with which high school diplomas can be obtained in today’s public school system, I would expect that the strong correlation between failure to obtain one and incarceration represents a single implicit “career choice” more than a lack of options.
wood turtle 05.29.07 at 4:04 pm
I don’t quite understand the Schumpeter quote. I would say just the opposite, that the budget is the ideology. As in, putting your money where your mouth is.
How much of the increase in incarceration rate is due to “three strikes and you’re out” and other more stringent incarceration policies?
Stuart 05.29.07 at 4:08 pm
The rate for black men seems to be declining—presumably that means that the major sentencing crackdown of the 1980s and 1990s had at least some effect.
How do you determine this from the quote you selected? Or are you using other statistics not quoted to make this statement?
Gdr 05.29.07 at 5:14 pm
Edward Tufte on choosing a baseline for a graph:
In general, in a time-series, use a baseline that shows the data not the zero point. If the zero point reasonably occurs in plotting the data, fine. But don’t spend a lot of empty vertical space trying to reach down to the zero point at the cost of hiding what is going on in the data line itself. (The book, How to Lie With Statistics, is wrong on this point.)
Kieran Healy 05.29.07 at 5:33 pm
I’d like to see the incarceration rates for black men without high school diplomas compared with the corresponding rates for white men.
The tables are in the paper linked in the post, dan.
bj4k 05.29.07 at 5:49 pm
Are people ignoring the obvious explanation here? Nowhere in the article, or the comments here, does anyone make the obvious connection between immigration (illegal and legal) and incarceration. Here’s a simple equation: California is replacing whites with Hispanics. Because Hispanics are incarcerated at a higher rate and pay taxes at a lower rate, that means the incarceration rate is rising faster than the tax base.
This is not about black men.
The Constructivist 05.29.07 at 6:40 pm
Still relevant after all these years, sadly.
Dan Simon 05.29.07 at 7:18 pm
The tables are in the paper linked in the post, dan.
Thanks for the pointer, Kieran. At a glance, it looks as though my hypothesis is partly correct, but not the whole picture. White men with no high school diploma are indeed incarcerated at an elevated rate–over 11 percent–by age 30-34, but that’s still nowhere near the nearly-60 percent figure for black men. The obvious question: what are all those non-criminal uneducated white men doing, and why aren’t more black men doing the same thing?
abb1 05.29.07 at 7:42 pm
Uneducated white guy is mowing lawns in a suburb and uneducated black guy lives in a ghetto. You didn’t know that the US underclass is comprised primarily of blacks?
Luis Alegria 05.29.07 at 11:58 pm
Mr. Abb1,
On the contrary, the US underclass is probably more Hispanic than black these days. The California ghettos have been getting very Hispanic for a couple of decades now, leading to different sorts of ethnic frictions.
Gentlemen,
One explanation for all this is California crime trends. The improving trend in crime rates from @1990/1992 began reversing from 2001-02. That mini-trend seems to have been squelched by 2004, and as of 2005 at least was declining again.
http://www.disastercenter.com/crime/cacrime.htm
Interestingly, overall per-capita California crime rates are back to 1960 levels, and the crime explosion of the 1960’s-70’s has been entirely reversed. I don’t know if this is solely due to public policy (policing and incarceration) but it seems likely that this played a significant part. A huge public policy success overall.
As for comparisons with other states – California has a relatively young population, which means more college students and more criminals, and everything around here is much more expensive. CA public higher education spending per capita is also several times that of other states. There are few places that spend so much per public college student.
Luis Alegria 05.30.07 at 12:33 am
Gentlemen,
The cause of the extremely high California prison spending is that it seems that it is extremely expensive to imprison people in California, at least 2.5X what Texas spends, and even more than what New York spends. I.e., its not that CA imprisons so many people, relatively speaking, as that does not seem out of line with its population and demographics.
Alan K. Henderson 05.30.07 at 10:06 pm
A chart comparing per-capita higher education and corrections spending would be useful. It would show whether or not the 2003 dip was due to a decrease in enrollments.
Stuart 05.31.07 at 5:36 pm
The 2003 dip in spending in California was due to the big budget deficit that got Gray Davis recalled?
BBC article around the time
Comments on this entry are closed.